Illusory Correlation: Definition & Examples
What is Illusory Correlation
Illusory correlation occurs when we incorrectly believe that two variables have a relationship with each other. For example, a soccer player may put tape around his socks before a game. They score a goal and attribute it to the fact that they are wearing tape. The connection between the two variables is an illusion.
In this example, the goal was not because the tape was worn, but rather the skill of the player. Yet, the player believes this to be the case in what is known as ‘illusory correlation’.
Key Points
- Illusory correlation occurs when we believe that two unrelated variables have a relationship between each other.
- Distinctive variables are more likely to result in illusory correlation. For example, the colour of an individuals hair or skin.
An important part of illusory correlation is that there are distinctive features or characteristics. In other words, people are more likely to incorrectly identify a distinctive variable than one that is not so noticeable.
For instance, Jason wears a pair of red pants for his interview. He gets the job and attributes it to his new ‘lucky red pants’. Even though he was wearing a new shirt and shoes. The fact was that the pants were distinctive and therefore more easily attributable.
Distinctive features and illusory correlation also help explain why and how stereotypes form and endure. For instance, we may come across one individual that appears to be sleeping on the job and being lazy. In turn, it is easy enough to attribute that to a distinctive feature. In many cases, this defaults to the color of their skin, sex, age, or other distinctive features.
What we see is a cause and effect situation, driven by an illusory correlation. This person is lazy. Why? Well, the color of their skin is an easy correlation to conclude. We then see people take that correlation forward to other scenarios. This can also be made worse by the confirmation bias which only seeks to reaffirm the existing illusory correlation.
History of Illusory Correlation
The term ‘illusory correlation’ was originally coined by Chapman and Chapman in their 1967 paper, ‘Illusory correlation in an observational report’.
Chapman and Chapman’s findings concluded that (a) words which have a strong associative connection are reported as correlated in their occurrence when not actually correlated and (b) that illusory correlation also occurs between distinctive stimuli.
David Hamilton and Robert Gifford built upon this research in 1976 to highlight that stereotypes can result from the illusory correlation. In their research, they found that if one group of persons “occurs” less frequently than another and one type of behavior occurs infrequently, then the above hypothesis predicts that observers would overestimate the frequency that that type of behavior was performed by members of that group.
In other words, because there is a specific and notable characteristic to a person, we start to associate that characteristic with their behaviors. For instance, we may see someone with blue hair cut us up on the road. In turn, we may come to expect that same behavior of future people with blue hair that we see.
Hamilton and Rose later added to the existing research in 1980. They found that illusory correlation and stereotypes have a lasting effect even when participants were presented with contradictory evidence. For example, common stereotypes such as Mexicans being lazy would often persist even though there was sufficient evidence to prove the stereotype wrong.
Hamilton and Gifford Illusory Correlation Experiment
In 1976, Hamilton and Gifford conducted a number of experiments to test whether illusory correlation is as a result of stereotypical beliefs. In their first experiment, they asked participants to read a number of desirable and undesirable traits. These were either linked to Group A (the majority) or Group B (the minority).
Two abstract groups were established in order to avoid any potential contamination from existing stereotypes.
As part of the experiment, Group A (the majority) had a higher number of desirable and undesirable traits in order to put them in the majority of the population. By contrast, Group B (the minority) had both fewer desirable and undesirable traits to ensure they are in the minority of the population. However, the percentage of desirable and undesirable traits was equal in each of the populations.
The aim was to ensure that both groups reflected the percent population in the real world. This can be seen in the table below.
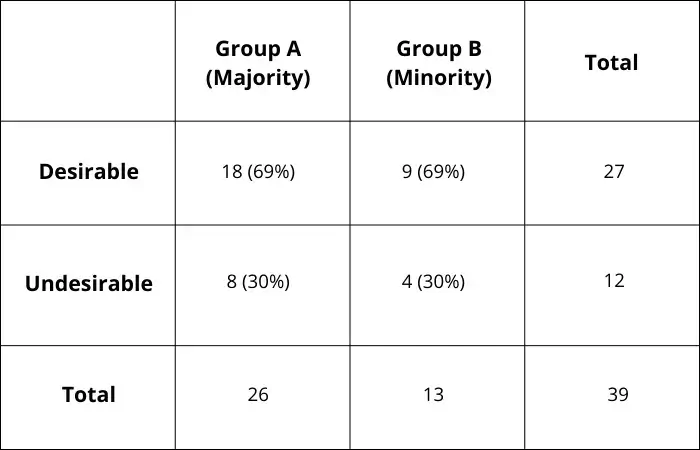
As we can see, both groups had the same percentage of desirable and undesirable traits. Results showed that participants correctly assigned desirable traits to each group. However, undesirable traits were overestimated within the minority population.
In other words, participants expected a higher level of undesirable traits in the minority population.
Examples of Illusory Correlation
Some examples include:
- A woman was attacked by a man with ginger hair. She now fears people with the same color hair.
- A soccer player wears a new pair of yellow boots. He scores a goal within minutes and believes that the boots brought him luck. He now wears them every game.
- A man takes his girlfriend to a new restaurant and finds a 50-dollar bill on the floor walking there. He immediately thinks the restaurant is lucky and therefore frequently visits for good luck.
- A couple lives nearby some immigrants that make an excessive amount of noise. When they move, they want to avoid living next to immigrants in the belief that they are all loud.
- A child gets bitten by a dog. In turn, the child becomes afraid of dogs and runs every time they see a new one.
- An old person tries to learn how to use a smartphone. However, it’s too difficult for them. They then say ‘this new technology is a load of rubbish’. All other technology is then branded with the same brush and the elderly person refuses to try again.
- A lady wins the lottery on her birthday. Thinking her birthday brought her good luck, she now buys a ticket each and every birthday.
- A young person tries steak for the first time but doesn’t like it. They, therefore, refuse to eat it again. However, factors such as the quality of the cut as well as the cooking are not considered.
FAQs
A woman was attacked by a man with ginger hair. She now fears people with the same colour hair.
It occurs when we incorrectly believe that two variables have a relationship with each other. The connection between the two variables is, in effect, an illusion.
It is important as it helps us understand why we incorrectly correlate the relationship between two variables. For instance, it helps example racism and sexism.
An illusory correlation is best defined as a belief that two unrelated variables have a relationship between each other. However, this is an illusion driven by a human need to see correlations where there are none.
About Paul
Paul Boyce is an economics editor with over 10 years experience in the industry. Currently working as a consultant within the financial services sector, Paul is the CEO and chief editor of BoyceWire. He has written publications for FEE, the Mises Institute, and many others.

Further Reading
 Cluster Sampling - Cluster sampling is a sampling technique in which the population is divided into groups or clusters, and a subset of…
  Centrally Planned Economy - A centrally planned economy is an economic system in which the government controls and manages the allocation of resources, production,…
  Embezzlement - Embezzlement is the act of fraudulently misappropriating or stealing funds or assets entrusted to one's care, often done by an…