Marginal Propensity to Consume: Definition, Formula & Example
What is Marginal Propensity to Consume
Marginal propensity to consume (MPC) refers to the percentage of the additional income that is spent. In other words, if a person was given $1 – how much of that will they spend and consume.
To put it another way, how much would the average consumer spend if they were to receive an additional level of income. The action or likelihood of spending is known as ‘propensity’, which refers to the inclination or tendency for a person to take an action. Therefore, when we talk about the marginal propensity to consume, we are referring to the tendency of a person to consume the additional income they receive and what percentage of that they would spend.
Key Points
- Marginal propensity to consume (MPC) refers to the tendency to spend additional income.
- It can vary depending on income levels. Those with higher incomes are more likely to save, whilst those on low incomes are more likely to spend on necessities.
- The multiplier effect is driven by MPC. As people spend a higher percentage of their incomes, government investment in the economy becomes more effective – driven by the nations MPC.
The marginal propensity to consume will usually fall between 0 and 1 as it refers to the percentage of income that is spent. The consumer can spend none of it, or all of it – but usually it is somewhere in between.
On the other side, we have the marginal propensity to save, which is the percentage of additional income the recipient saves instead of spends. Put together, the marginal propensity to consume and save adds to a total of 1.
Marginal Propensity to Consume + Marginal Propensity to Save = 1.
Marginal Propensity to Consume Formula
Marginal propensity to consume is equal to the change in consumption divided by the change in income. So if income increases by $1 and the consumer spends $0.80, the formula would be 0.8 / 1, which equals 0.8.
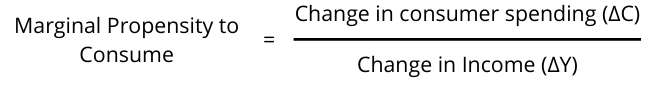
If you were to receive a $1,000 bonus this year, you would have $1,000 more than previously – representing a $1,000 change in income. Now suppose you spend $500 of this new income. That represents a $500 change in consumer spending. So the formula would divide the new expenditure ($500) by the new income ($1,000), which equals 500/1,000 = 0.5.
This then leaves us with the marginal propensity to save. If the money is not spent in the economy, it is saved. This is calculated using the formula:
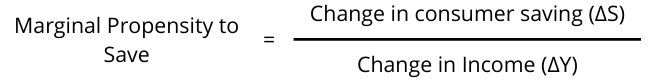
In this case, the marginal propensity to save is the change in consumer saving ($500) divided by the change in income ($1,000), which equals 500/1,000 = 0.5.
Marginal Propensity to Consume Diagram
If we now look at the diagram for marginal propensity to consume, we can see that there is consumption even when income is zero. This is known as autonomous consumption. People will always need basic necessities such as food and water to survive. So when income is zero, they rely on loans or charity to buy necessities.
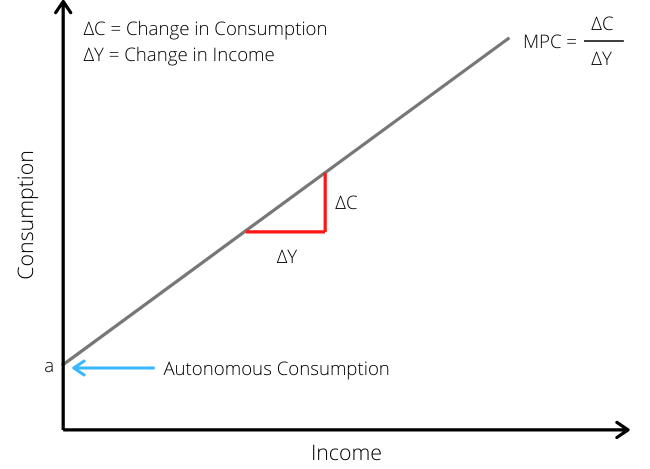
As we can see from the diagram above, the marginal propensity to consume can be calculated at any point on the line. So it can be at any point in time across a large range of incomes or income gains.
Income level is an important aspect of the consumer’s propensity to consume. At higher levels of income, consumers are more likely to save. After all, once necessities are accounted for, they have less of a need to spend the additional income.
Marginal Propensity to Consume Example
Let us take an example and say that Company A gives all of its 100 employees a bonus of $1,000 each – worth $100,000. Some of the employees spend $400, some spend $750, and others spend $200 of it. However, on average the 100 employees spend $600 of their bonus.
If we now look at the Marginal Propensity to Consume formula:
The change in income was $1,000 as each employee received this in the form of a bonus. The change in consumer spending, on average, was $600. So the calculation would be 600 divided by 1,000, which equals 0.6.
Factors that affect Marginal Propensity to Consume
1. Income Levels
At low-income levels, people have a higher propensity to consume. This is because they need to spend a greater proportion of their income in order to pay for necessities. Goods such as food, electricity, and rent are all necessities that can take up a high proportion of their incomes.
As incomes increase, people spend a lower proportion of their income as they are already satisfied by the goods they have. Whilst more is spent on luxuries, the incentive to spend additional income is lower as it is not necessary for survival.
2. Type of Income Increase
If the new income is a one-off, some recipients may treat this in a different way as the gain is temporary. Some may spend the whole lot as they see $1,000 straight into their bank account, whilst others may be more inclined to save.
We also have more permeant income increases – usually an increase in wage. For this type, a $1,000 raise over the year may not even impact consumer behaviour – which would work out as $83 a month. It may go unnoticed by many.
3. Interest Rates
At higher interest rates, there is a greater incentive for people to save – after all, they can delay gratification and receive more goods in the future. However, at lower interest rates, borrowing becomes cheaper, and the incentive to spend increases, whilst the incentive to save decreases.
When faced with the alternative of earning 0.5 percent interest or buying a new car, the decision is that much easier. By contrast, earning 5 percent interest makes the decision more difficult. The reason being is that there is a greater opportunity cost. If the two options are spending $20,000 on a car or earning interest – this would work out at $100 interest when the rate is 0.5 percent. By contrast, at 5 percent, the interest is $1,000 – meaning the consumer has to give up a much larger percentage of their income to buy the car.
So at lower interest rates, people are more likely to spend, thereby increasing the marginal propensity to consume.
4. Consumer Confidence
During recessionary periods or times of uncertainty, people are more likely to save in fear they may lose their jobs. In such an event, they may lose their house and have no income to support their family. People react by saving in order to weather the potential storm.
At the same time, when times are good and the economy is booming, people feel more confident and increase their spending.
5. Inflation
At high levels of inflation, goods can be increasing in price rapidly. This can create a level of urgency among consumers that want to get the product before it goes up in price again.
By contrast, deflation is associated with prices that are falling. This encourages people to delay consumption and instead save as prices will be lower in the future.
6. Personal Preferences
Everyone is different when it comes to spending money. Some are more conservative and generally like to save, whilst others are very frivolous. This can extend from a personal level to a national level. For instance, Japan is known for its high savings rate, whilst countries such as the US and the UK have a higher consumption rate.
Marginal Propensity to Consume Multiplier
The multiplier effect is where an initial injection into the circular flow of income can create a multiplying effect. In other words, an investment of $10 million by the government can lead to a $30 million stimulus to the economy. This is because the initial investment trades hands more than once, thereby stimulating demand for more and more products, contributing to a domino effect.
So where does marginal propensity to consume come in? Well the multiplier effect is calculated using the formula:
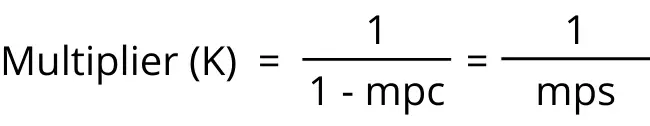
The marginal propensity to consume determines the extent of the multiplier effect. In other words, a higher marginal propensity to consume will increase the economic effect of an initial investment.
For example, if the government invests $10 million in the economy, that money goes towards a business’s employees. Those employees can then choose to spend or save that money. If they have a high propensity to consume, it is spent at another business. In turn, those employees also can save or spend that money.
What we have is a domino effect that stimulates the wider economy – but is dependent on people’s willingness to spend. In other words, their marginal propensity to consume.
So the more willing people are to spend, the greater economic affect the initial government investment will have.
FAQs
MPC stands for marginal propensity to consume. This refers to the tendency for individuals to spend additional income they receive. By contrast, MPS stands for marginal propensity to save and refers to the tendency to save additional levels of income.
Propensity refers to the tendency to behave in a particular way. So the propensity to consume refers to the tendency for an individual to consume, or spend.
You can calculate the marginal propensity to consume using the formula:
Marginal Propensity to Consume = Amount of increase in Expenditure / Amount of increase in Income
For example, if Consumer A spends $1,000 more a year, but they only receive a $500 pay rise – their marginal propensity to consume would equal $1,000/$500 = $2.
About Paul
Paul Boyce is an economics editor with over 10 years experience in the industry. Currently working as a consultant within the financial services sector, Paul is the CEO and chief editor of BoyceWire. He has written publications for FEE, the Mises Institute, and many others.

Further Reading
 Centrally Planned Economy - A centrally planned economy is an economic system in which the government controls and manages the allocation of resources, production,…
  Real GDP: Definition & How to Calculate - Real GDP is Gross Domestic Product (GDP) that accounts for inflation or deflation.
  Intrinsic Value - Intrinsic value refers to the underlying or inherent worth of an asset, based on its fundamental characteristics and cash flow…