The Gini Coefficient: Definition, How to Calculate & Formula
Gini Coefficient Definition
The Gini coefficient is a statistical measure used to calculate inequality within a nation. It does so by calculating the wealth distribution between members of the population. Through this calculation, we achieve a result between 0 and 1, which 0 representing perfect equality, and 1 absolute inequality.
Originally thought of by Corrado Gini in 1912, it is most commonly used to measure income inequality. Both the World Bank and the UN produce annual statistics for the Gini coefficient, and many governments use it to track its inequality. For example, the UK’s Office for National Statistics (ONS) produces an annual report highlighting historical statistics of the Gini coefficient. The US’ Census Bureau department also releases a number of reports on the Gini Coefficient, keeping track of its movements.
Key Points
- The Gini Coefficient is a statistical measure that calculates inequality.
- It measures inequality by measuring the distribution of income across the country.
- Although the Gini coefficient measures wealth inequality, it doesn’t measure or factor in overall wealth.
The Gini coefficient, also known as the Gini Index, is widely used across the world. It is one of the most efficient and easily understood figures on inequality, which makes it easier to compare countries. At the same time, it does have its drawbacks which we will look at later.
How is the Gini Coefficient Calculated
There are two ends of the measurement, ranging from 0 to 1. At 1, the measurement would show that one person receives all the national income. By contrast, a measurement of 0 would suggest that income is perfectly split between all members of society. In other words, 0 = complete equality, and 1 = complete inequality.
The Gini coefficient is calculated using the Lorenz Curve. This can be illustrated in the graph below. To explain, each percentile is plotted on the graph with a line situated at 45 degrees. This line represents perfect equality. So the bottom 10 percent of the population receives 10 percent of income, whilst the top 10 percent also receives 10 percent of income.
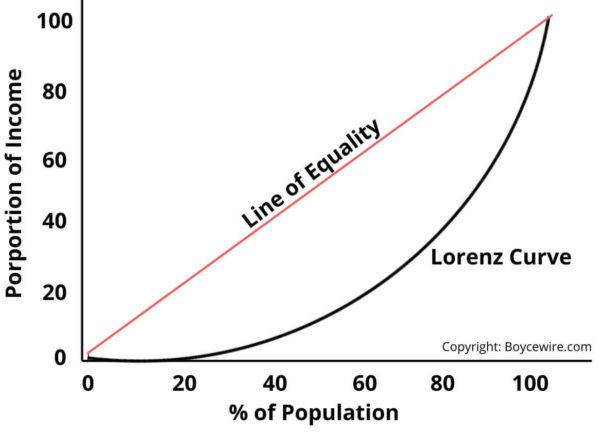
Along this line, the percentiles are populated below this, creating what is known as the Lorenz Curve. The reason the curve is situated below is that a situation cannot exist whereby the bottom 50 percent receive more than 50 percent of income. If they did then they wouldn’t be in the bottom 50 percent.
Once each percentile has been placed onto the graph, we are left with the curve. The area between the curve and the line of equality is then used to calculate the Gini coefficient.
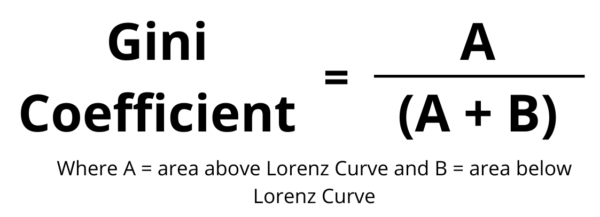
The area above the Lorenz Curve and towards the line of equality is referred to as ‘A’ and the line below as ‘B’. This can be seen in the chart below.
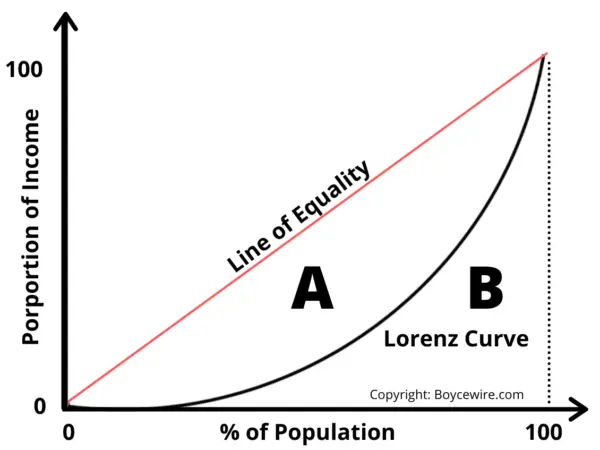
To calculate the Gini coefficient, we must first measure the area of ‘B’. We can do this by splitting down each segment into triangles and squares. Let us take a simple example below. If we split it down, we can create 3 segments illustrated below.
Area 1 = width (50) x height (25) x 0.5 (as it’s a triangle) = 625
Area 2 = width (50) x height (25) = 1250
Area 3 = width (50) x height (75) x 0.5 (as it’s a triangle) = 1875
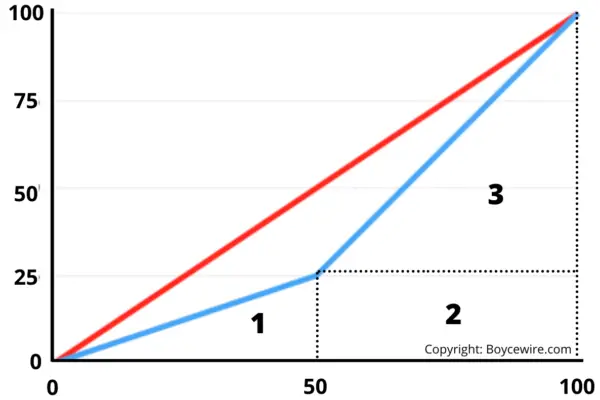
So the total area of ‘B’ equals the combined total of the three areas. This equals 625 + 1250 + 1875 = 3750. The area of ‘B’ is therefore 3750.
Gini Coefficient Formula
The Gini Coefficient formula is calculated using = A / (A + B). Where ‘A’ is the area above the Lorenz Curve and ‘B’ is the area below.
From the previous example, we have already worked out B = 3750. We can then work out the area of ‘A’. The line of equality can be calculated by using the total area of the triangle. This equals 100 x 100 x 0.5 (as it’s a triangle). In turn, we get 5000 as our figure. So this is the total area of the triangle (which includes both A and B). We already have the area of B (3750), so the area of A is the difference (1250).
We can now plug those figures into the formula:
Gini Coefficient = 1250 / 1250 + 3750 = 0.25
What the Gini doesn’t show
The Gini coefficient shows the distribution of income within a country. What it doesn’t show is how wealthy that country is in the first place. For instance, OECD data shows that the United States and Lithuania have a similar Gini coefficient score at around 0.38. However, the Gini coefficient does not consider the quality of life or general economic well-being. So it only tells part of the story.
If we look at the US compared to Lithuania; their Gini coefficients are similar. Yet the US has a GDP per capita that is 3.7 times that of Lithuania. Wages are equally disproportionate.
What should be considered the average quality of life? Perfect equality may be considered a positive thing, but not if everyone is equally poor. If everyone has an income of $1 a month, they may all be equal, but they aren’t going to be able to afford much.
Related Topics
FAQs on the Gini Coefficient
A high Gini coefficient means that the nation has a high level of income inequality. So the highest earners in society take home a significant proportion of the nations income.
The Gini coefficient is calculated on a scale of 0 to 1, with 1 being perfectly inequal, and 0 being perfectly equal.
The Gini coefficient can be calculated using the formula: Gini Coefficient = A / (A + B), where A is the area above the Lorenz Curve and B is the area below the Lorenz Curve.
About Paul
Paul Boyce is an economics editor with over 10 years experience in the industry. Currently working as a consultant within the financial services sector, Paul is the CEO and chief editor of BoyceWire. He has written publications for FEE, the Mises Institute, and many others.

Further Reading
 Marginal Cost: How to Calculate, Formula & Examples - Marginal cost refers to the additional amount it costs to produce one extra good.
  What is Supply and Demand? - Supply and demand. Demand and supply. However you call it, they both interact with each other. So what is supply…
  Corporate Social Responsibility (CSR): Definition & Examples - Corporate Social Responsibility (CSR) is a type of corporate strategy that looks at how the business can better society as…