Income Statement: Definition, Format & Example
What is an Income Statement
The income statement details the firm’s revenue and expenses during a period of time. Also known as a ‘profit and loss statement’, it highlights how much the firm has sold and how much it has spent. This is broken up into ‘cost of sales’ which shows how much the firm has spent to produce the goods it has sold. There are then ‘operating expenses’ which cover expenses such as rent, utilities, and insurance.
A firm’s income statement is one of three parts of a firm’s financial reporting. The other two are the balance sheet and the statement of cash flows. Put together, these provide investors with useful information to determine the suitability of an investment.
Key Points
- The income statement shows a companies revenue, expenses, and profit.
- The most common format for the income statement is the multiple-step which segments expenses between ‘cost of goods’ and ‘operational expenses’.
- Whilst the balance sheet looks at a firms financial stability, the income statement looks at the firms profitability.
Income Statement Format
The income statement can come in two main formats – single-step, or multiple-step. A single-step income statement is relatively basic and straight forward. It has two sections. The first of which shows the companies revenue. The second shows expenses.
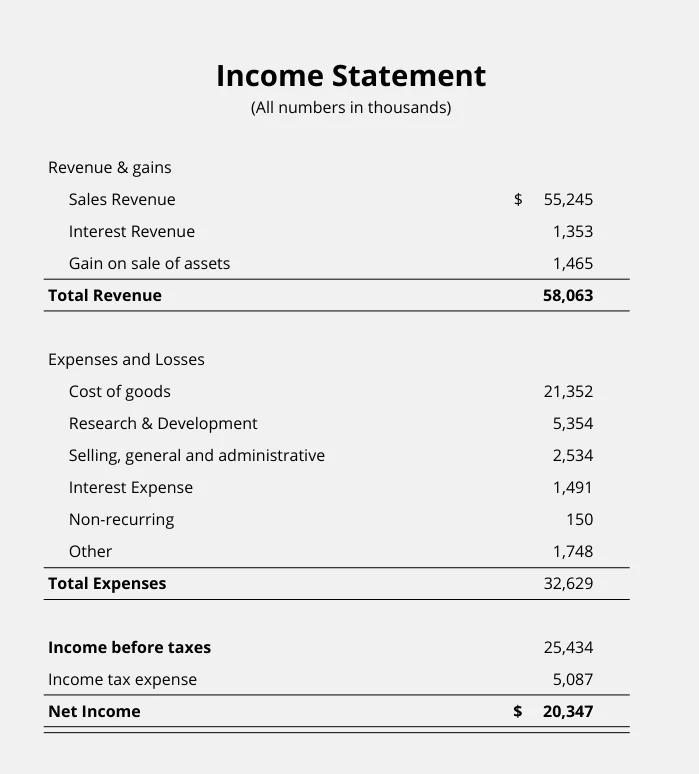
As we can see from the example of the single-step income statement below, it’s a very basic statement. All revenue streams are simplified and compiled in one section, with all expenses allocated separately. Due to the simplicity, it’s very uncommon among public companies.
Single-step Income Statement Example
Most public companies will use a multiple-step format for its income statements. The reason for such is that it provides much more detail for investors. Expenses are broken up into direct and indirect costs. Direct costs are essentially what it costs to make the goods, whilst in-direct costs include everything else.
For example, direct costs and the cost of production can be used interchangeably. This is simply the raw materials and the labor a firm needs to make the final product. For instance, a motor vehicle will need raw materials such as steel and glass, as well as laborers to put it together. Collectively, these will make up the production costs.
The multiple-step income statement segments the production costs and operational costs. These include more general expenses such as advertising, research and development, accounting, utilities, and legal fees.
Multiple-step Income Statement Example
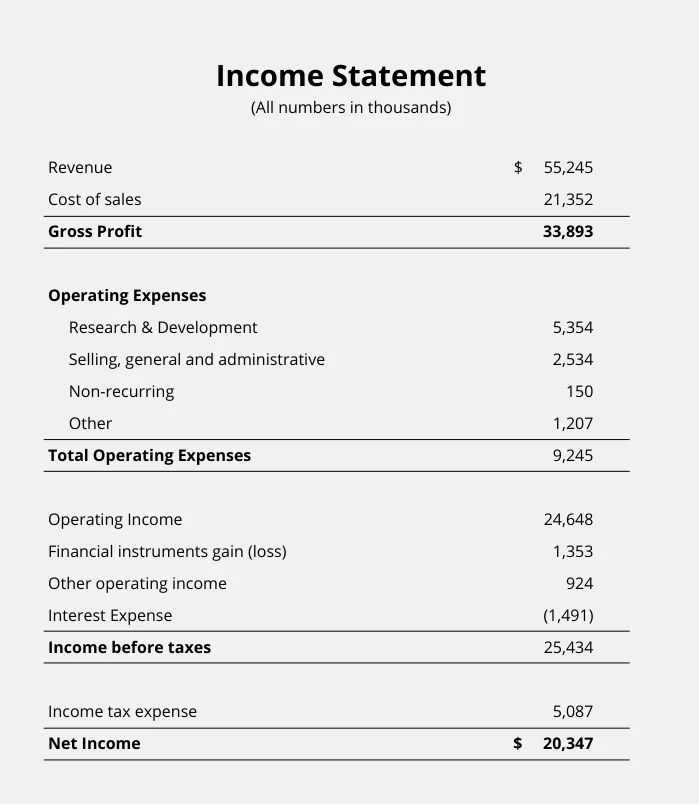
From the multiple-step income statement shown above, we can see there are a number of different elements. Let’s look at them in more detail below:
Revenue
From the example income statement above, we can see that revenue amounted to $55,245,000 (noting figures are in thousands). This figure is how much the company sold within the reporting period.
Cost of sales
As we can see, the cost of sales was $21,352,000. This simply refers to how much it cost to make the goods. For example, manufacturers will pay for the raw materials and labor costs to make its goods. For those service businesses such as hairdressing, this will just cover the hairdressers salary. Any equipment such as hair-clippers will go under a separate expense – depreciation.
Gross Profit
From the example of the income statement above, we can see the main areas of the statement. The first is Gross Profit. This is the firm’s total revenue minus the cost of production. By cost of production, we include costs such as labor and raw materials. For example, to make 10 loaves of bread, it may take an employee 1 hour at $15 an hour. The cost of the flour and yeast amounts to $2. So the total cost of production would amount to $17.
Operating Expenses
Operating expenses refer to costs the company incurs that are outside production. For example, this might be HR costs, advertising and marketing, or research and development. Some firms will categorise these costs differently. For tech and pharmaceutical companies, research and development will have its own line as it’s a huge expense.
Other examples of operating expenses include rent, utilities, property taxes, office supplies, depreciation, and insurance.
Operating Income
On the income statement, operating income is simply the firm’s gross profit minus any operating expenses. Gross profit doesn’t include operating costs such as advertising or research. By adding in these costs, we find the firm’s underlying profitability. Otherwise known as ‘Operating Profit’, this represents a more established picture of the firm’s profitability.
Income before taxes
Income before taxes includes operating income, but also other streams of income/expenses. This might include gains or losses from disposals, interest income, or dividend income. For example, the firm may have some financial investments which it earns interest on.
Net Income
On the income statement, a firm’s net income is known as the ‘bottom line’ profit. This is essentially the profit the firm makes once all costs are paid for. It is calculated by taking income before taxes and subtracting away any taxes which are liable. It is known as ‘the bottom line’ because it is the bottom line of the statement. Many investors will see this as one of the key financial metrics.
Types of Income Statement
1. Comparative Income Statement
The comparative income statement is one that public corporations frequently use. It shows multiple reporting periods on the right to highlight comparative performance. This might be comparing against last years performance, or perhaps comparing quarter on quarter.
Most public corporations use this type of statement as it provides investors with an insight into the current trajectory on the company. By showing previous reporting periods, investors can see whether revenue is growing, expenses are increasing, or net profits are staying stagnant.
2. Common Size Analysis Income Statement
The common size analysis statement takes revenue and allocates it as 100 percent. All other metrics such as cost of goods, operational expenses, net income etc. are then allocated a percentage next to them. For instance, if revenue was $100 and net income was $10, then it would have a percent rate of 10%. Each line will have a relevant percentage.
This type of Income Statement is useful to compare against other companies or industries. It provides a better comparison as some companies may make $100 million, whilst others make $50 million – which also skews the expenses. Instead, by allocating a percentage, investors can compare how much of a firms revenue is being spent on cost of goods or operating costs.
3. Condensed Income Statement
A condensed statement shows only the high-level reporting figures such as revenue, cost of goods, operating expenses, and net income. It doesn’t go into any detail in terms of how those expenses are broken down, only providing ‘headline’ figures.
This can prove useful for lenders who are purely looking for high-level figures to provide an indication of the firms profitability.
4. Contribution Margin Income Statement
Companies generally use the contribution margin statement for internal purposes only. It breaks down the key financial figures into either geographical or product-based segments. This is the separated on the statement through different columns, each next to each other. For example, an international firm might have columns for Europe, North America, and Asia. Each would show different figures for revenue by region, as well as all the other metrics such as net income, operating expenses, etc.
The ‘margin’ is then shown below the costs to compare profit margins between regions or product classes. This is useful for internal purposes as it shows which regions or products are doing well and which are underperforming.
5. Single-Step Income Statement
The single-step statement is one of the most commonly found, particularly among small companies. This is because it’s a relatively simple statement that only includes totals for revenue and expenses. Instead of complicating the figures by segmenting operating and non-operating expenses, it’s a straight forward ‘profit & loss’ statement.
Many small companies will use this type of income statement due to its simplicity. It’s unapologetically simply and for small business owners, it’s useful to keep track on profitability without having an accounting degree.
6. Multi-Step Income Statement
The multi-step income statement, otherwise known as the ‘multiple-step’ or ‘classified’ statement, is a more advanced version of the single-step. It uses more segmentation, allowing greater scope for analysis regarding the firms operating costs and income.
By segmenting operational costs, investors can gain a better insight into how much it costs to run the business outside of its core operations. When compared to other companies, it may show that there is excess waste being spent on operational activities which aren’t flowing through to higher revenues.
Income Statement Example
Reading Income Statements
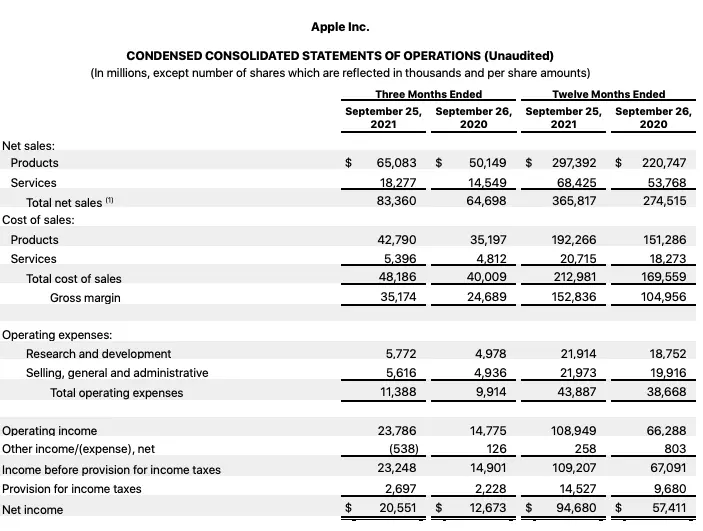
To help understand the income statement, we will take Apple’s condensed consolidated statement for 2021. This is a relatively simple statement with few components, so it should provide a good basic understanding of how the statement works.
Dates
On this statement, we can see that Apple has two separate comparison columns. The first of which is comparing the previous three months from September 25, 2021 and September 26, 2020 respectively. These show the figures from June to September.
There is also a comparison for the ‘12 months ended’ for 2021 and 2020. This provides a comparison from the previous year to allow investors to see how the companies performance has progressed.
Net Sales
On some other income statements, this might show as ‘revenue’. However, on this income statement, Apple has divided its revenue streams between ‘Products’ and ‘Services’. The most likely reason for this is that Apple has recently invested significant sums to build up its service portfolio. So this can be a useful metric to see how this has progressed.
Cost of sales
The cost of sales section takes into consideration the cost of raw materials and labor. In the example of Apple, this will include items such as batteries, camera’s, glass, and speakers. From the labor side, this is likely to include only those from production who are making the goods. Again, Apple has broken this up into its ‘Product’ and ‘Service’ operations which amounts to a total of $212.98 billion in the 12 months ended 2021. It’s important to note that it says ‘$212,981’ but these figures are in millions, as noted at the top of the statement.
Gross Margin
Although the Apple statement shows ‘Gross Margin’, it is also known as ‘Gross Profit’. This is simply the firms total revenue minus its cost of sales. In this example, it would equal $365.82 billion at the end of year, September 2021. Over the same period, its cost of sales equal $212.98 billion. When we subtract those costs from total sales, we end up with a Gross Profit/Gross Margin of $152.84 billion.
Operating Expenses
The next part of the income statement is operating expenses. These include all expenses outside the cost of production. In the example of Apple, this has been broken down into ‘Research and development’ and ‘Selling, general and administrative’.
Research and development costs would include the development of software and the design of the latest iPhone, MacBook, and other product lines. Selling and general administrative costs would include the running of its Apple stores, customer service, and sales departments – among others.
As we can see from the statement, Apple spent $21.91 billion on research and development in the year to September 2021. This was closely followed by its selling, general and administrative costs of $21.97 billion. So in total, Apple spent $43.89 billion on operating costs for the year.
Operating Income
Operating income is the calculation between gross profit/margin and operating expenses. We can also find this value by taking net sales or revenue and subtracting away the cost of sales and operating costs. In other words, operating income represents the income a firm receives once it pays all its costs.
In the case of Apple, it made $365.82 billion in sales in the year to September 2021. We then take away the cost of sales, $212.98 billion, as well as the operating costs, $43.88 billion. This then leaves an operating income of $108.95 billion.
Other Income/Expense
On some companies statement, there may be a line of ‘other income’. This represents income that is attributable to operations outside its normal functioning. For example, in the case of Apple, it produces technology and mobile devices. These other forms of income might be investments into the stock market or interest on government bonds/gilts.
Provision for income tax
Provision for income tax is the amount the firm budgets to pay tax. This is calculated by taking the firms income before tax and multiplying it by the relevant tax rate.
Net Income
The net income is the firms income before provision of tax mins any taxes liable. This is revenue minus cost of goods and operating expenses, plus any other additional income, and minus any taxes. In this example, Apple’s net income amounts to $94.68 billion for the year to September 2021.
Income Statement Formula
Gross Profit
On the income statement, there are three main calculations. The first of which is Gross Profit. This is simply the amount of profit the firm makes after it pays for the cost of goods. So we take away this cost from the firms total revenue.
Operating Income
A firm’s operating income is the gross profit minus any operating expenses. These operating expenses include utilities, rent, advertising, research and development, or insurance costs. Essentially, any business costs that don’t relate to the cost of goods.
Net Income
Net income is known as the ‘bottom line’ due to the fact that it’s the last line of the income statement. It can be calculated by taking operating income and adding it to any additional non-operating income. This might include income from financial investments or gains and losses from foreign exchange rates and asset write-downs.

Income Statement vs Balance Sheet
Both the income statement and the balance sheet make up an important part of a companies financial statement. However, they differ in a number of ways. First of all, the income statement shows cash inflows and outflows. This includes money going in through revenue/sales, and money going out through costs of raw materials, labor, rent, and tax.
By contrast, the balance sheet shows the companies assets, liabilities, and shareholder equity. This helps to provide an overview of the companies financial stability. For example, if the firm has more liabilities than assets, then it’s in trouble. However, if the difference between assets and liabilities is high, then it would have an equally high shareholder value. This is because the difference between assets and liabilities reflects the underlying value of the company.
Whilst the balance sheet helps to determine financial stability, the income statement shows a firms profitability. It shows cash going in and cash going out. It shows that the firm can sell goods and turn a profit over a period of time.
Income Statement FAQs
The purpose of an income statement is to show a companies profit and loss. It shows how much money comes in through revenue, and how much goes out through cost of goods, and operating costs. It helps show the underlying profitability of a firm.
The three parts of the income statement are revenue, expenses, and profit. Otherwise known as ‘net sales’, revenue reflects how much a company brings in. Expenses are generally broken down into ‘cost of sales’, which are generally the raw materials, and ‘operating expenses’, which are all other costs such as rent, labor, utilities, and machinery.
The purpose of the income statement is to show a company’s profitability over a period. It shows how much money it gets in and how much it spends, leaving the net profit of the company during a set period.
About Paul
Paul Boyce is an economics editor with over 10 years experience in the industry. Currently working as a consultant within the financial services sector, Paul is the CEO and chief editor of BoyceWire. He has written publications for FEE, the Mises Institute, and many others.

Further Reading
 Egalitarianism: Definition, Types & Example - Egalitarianism is the philosophic idea that all individuals are born equal and should be treated in such a way.
  Balance Sheet: Definition, Format & Example - The balance sheet is a key financial statement that public and private companies report on. It highlights a firm's assets,…
  Crowding Out Effect - The crowding out effect refers to the reduction in private sector investment caused by increased government borrowing and spending, leading…