Income Effect: What it is, Examples & Graph
What is Income Effect?
The income effect is where a change in income has a subsequent effect on demand. In other words, as consumers disposable incomes rise, they will demand more goods and services. This could be driven by lower prices, thereby reducing the consumers expenditure, or, through higher wages and other streams of income.
For instance, Jill buys a cup of coffee each day for $4. The coffee store decides to offer a half price discount on Monday’s, meaning the coffee is now $2. So Jill has an extra $2 that she would have previously spent on her one coffee. She then decides to spend that money on another coffee, thereby increasing the demand for coffee.
Key Points
- The Income Effect is where demand changes in reaction to an increase or decrease in income.
- The Income Effect is a key part of the demand curve which slopes downwards to the right – showing greater demand at lower prices.
- Disposable incomes may rise from higher wages and other income streams, or, through lower prices on goods usually purchased.
The income effect is closely tied to the demand curve which slopes downwards and to the right – which shows that demand increases as prices fall. The rationale behind this is that as prices fall, it creates more disposable income for the consumer. With that disposable income, the consumer is then able to purchase more goods, thereby stimulating demand.
Income Effect Examples
The income effect is where a change in consumers income affects demand and their purchasing decisions. Some examples include:
Example #1 – Higher disposable income, higher demand
Let us say that Mr. Bloggs travels to work each day and, on his journey, he buys a bagel for $3 from the local cart. After many years of going to the same cart, it is struggling for business, so reduces its prices to attract more custom. Mr. Bloggs is now paying $1.50 for the same bagel he used to purchase. This now saves him $1.50. With the newfound disposable income, he now purchases two bagels instead, thereby increasing demand.
Example #2 – Lower disposable income, lower demand
Let us say Miss Jones goes out with her friends to eat at a local restaurant three times a week – costing her $30, at $10 a visit. The restaurant is doing well and is busy every day, so increases its prices. In turn, the cost to Miss Jones to visit the local restaurant increases to $15 a visit. Therefore, the initial $30 she spent on three visits will only be able to afford her two. We then see Miss Jones cut back on her restaurant visits as a result of the lower level of disposable income she has – thereby reducing demand.
Example #3 – Increase in disposable income, higher demand
Mr Ryan is on a wage of $30,000 a year and buys $20,000 worth of goods. After tax and his expenditures, he is only left with $1,000 which he saves each year. He has been working hard all year and his manager decides to give him a promotion which takes his pay up to $35,000 a year – which increases his disposable income by around $3,000 after tax. He then has that money to spend on a number of goods such as video games or a new jumper.
Income Effect Graph
What we can see in the income effect graph below, is the transition between incomes. First of all, the level of disposable income is illustrated on the grey line at DC1. This demonstrates the consumer’s initial income. The curve that intersects it at point A is known as the indifference curve. It is essentially a demand curve that shows how the quantity demanded increases at lower prices, but at the same level of utility.
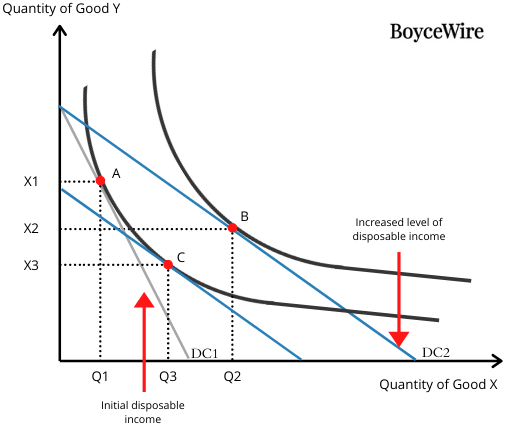
In this graph, we demonstrate what happens when the price of Good X decreases. What happens is that the consumer’s disposable income increases. This shifts the DC line from DC1 (the grey line), to DC2 (the blue line). This demonstrates that the consumer has more disposable income and can therefore demand more of Good X.
At point B, we see both the combined effect of the lower price which attracts customers through the substitution effect, but also the increase in disposable income, which attracts customers through the income effect. The shift from Point A, to Point B, shows the total effect of a decrease in price – including both the substitution effect, as well as the income effect.
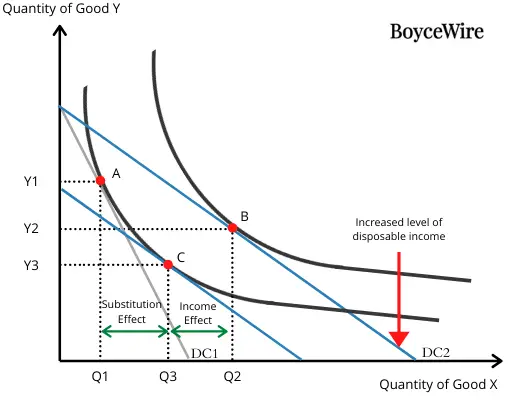
As we can see from the graph above – the initial starting point is at Point A where disposable income is on the grey line (DC1). At this point, the demand for Good Y is Y1 and Good X in Q1. When the price of Good X decreases, it has a substitute effect. In other words, customers who used to buy Good Y will buy more of Good X as a result. This is demonstrated at point C. So the difference between Q1 and Q3 is known as the substitute effect.
The income effect is the boost in the quantity that is achieved as a result of consumers having a greater quantity of disposable income – which is demonstrated by the difference between point C and point B.
Income Effect and the Substitution Effect
As disposable income increases, it results in higher demand for goods. If the increase comes from a salary increase or other streams of income, it can lead to an increase in demand for many goods. However, if disposable income increases as a result of lower prices, it means that the consumer is able to buy more goods.
Lower prices mean consumers will be attracted to move from substitute goods. For instance, the KFC might reduce the price of its meals by 10 percent. In turn, some customers from McDonald’s will shift their demand towards KFC. This is known as the substitution effect.
By contrast, the income effect refers to how demand increases as a result of higher levels of disposable income. For instance, Starbucks may reduce its prices by 20 percent, which gives existing consumers a higher level of disposable income as they are no longer spending as much. In turn, they can use that additional income to demand more goods – which is known as the income effect.
FAQs
The income effect is where a change in disposable income affects the demand for the good. For instance, a price cut will give customers more disposable income by which they may look to actually buy more.
A consumer reduces the amount of a good they purchase when the price increases, but their income stays the same. For example, if the price of gasoline increases, a consumer may reduce their driving or switch to a more fuel-efficient car, even if their income remains the same.cks reduces the price of its coffee by 20 percent, it will give its loyal customers a boost in disposable income. In turn they may visit the store more often.
A positive income effect is where consumers disposable income has increased, so they start to demand more goods and services.
The income effect can be caused by a variety of factors, including changes in income, changes in the prices of goods or services, changes in tastes or preferences, and changes in social norms or expectations.
About Paul
Paul Boyce is an economics editor with over 10 years experience in the industry. Currently working as a consultant within the financial services sector, Paul is the CEO and chief editor of BoyceWire. He has written publications for FEE, the Mises Institute, and many others.

Related Topics
Further Reading
 Game Theory: Definition & Examples - Game theory is the study of strategic decision making between individuals.
  Depreciation - Depreciation is an accounting method that allocates the cost of an asset over its useful life to reflect its gradual…
  Income Statement: Definition, Format & Example - The income statement details the firm's revenue and expenses during a period of time.