Correlation Coefficient: Definition, How to Calculate & Examples
What is the Correlation Coefficient?
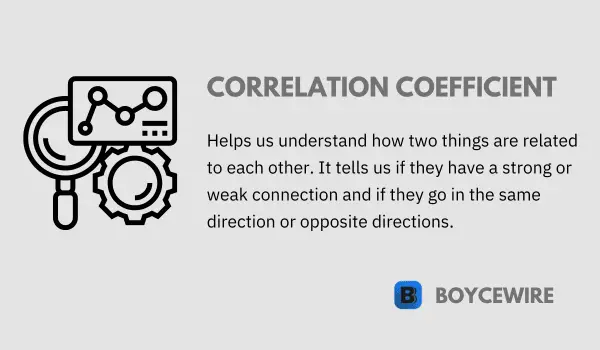
In the realm of statistics, the correlation coefficient plays a fundamental role in understanding the relationship between two variables. It serves as a quantifiable measure to establish the degree and direction of the correlation between variables. It is essential in various fields of study, including finance, psychology, sociology, and economics, to draw meaningful insights from data.
Its value lies between -1 and +1, indicating the strength and direction of the relationship. A value of +1 denotes a perfect positive correlation, where both variables move in the same direction, while -1 represents a perfect negative correlation, where variables move in opposite directions.
Key Points
- The correlation coefficient ranges between -1 and 1, where -1 represents a perfect negative correlation, 1 represents a perfect positive correlation, and 0 represents no correlation.
- A positive correlation indicates that as one variable increases, the other variable tends to increase as well, while a negative correlation indicates that as one variable increases, the other variable tends to decrease.
- The correlation coefficient does not imply causation, as it only measures the strength and direction of the relationship between variables.
Understanding the Correlation Coefficient
The correlation coefficient is a statistical measure that tells us how strong the relationship is between two variables – generating a number between -1.0 and 1.0. If this number is greater than 1.0 or less than -1.0, it means there was a mistake in the correlation calculation.
- Positive Correlation If the coefficient is closer to +1, we can say that there is a strong positive correlation between the two variables. That means, if one variable increases, the other variable also increases. Similarly, if one variable decreases, then the other variable also decreases.
- Negative Correlation If the coefficient is closer to -1, it indicates a strong negative correlation – which means that there is an inverse relationship between the variables. In other words, when one variable increases, the other variable decreases.
- No Correlation If the coefficient is around 0, it shows no correlation, implying that movements in the variables are not associated.
It’s important to note that correlation doesn’t imply causation. Just because two variables correlate does not mean that changes in one variable are responsible for changes in the other.
The coefficient is extensively employed in science, to help quantify the level of linear relationship between two variables. It is a key tool in the fields of statistics and data analysis.
Types of Correlation Coefficients
Different types of correlation coefficients are used depending on the nature and distribution of the data. Here are the most common types:
- Pearson Coefficient (r) Pearson’s r is the most widely used coefficient. It measures the linear relationship between two variables that are both normally distributed.
- Spearman’s Rank Coefficient (ρ or rs) Spearman’s correlation coefficient is particularly useful in situations where the data does not adhere to a normal distribution or when assessing relationships that involve ordinal variables, where respondents can rank their responses.
- Kendall’s Tau (τ) Kendall’s Tau is another non-parametric measure of correlation that is used for ordinal variables. It measures the strength of dependence between two variables.
- Point-Biserial Coefficient (rpb or rbs) This is a special case of the Pearson correlation where one variable is continuous and normally distributed, while the other is dichotomous.
- Phi Coefficient (Φ) The Phi Coefficient is used when both variables are dichotomous and it is equivalent to Pearson’s r.
- Partial Coefficient This statistical measure evaluates the extent of association between two random variables while eliminating the influence of a set of controlling random variables. It enables the assessment of the relationship between the variables of interest while accounting for the potential confounding effects of other variables.
Each of these coefficients provides a unique method for summarizing a different type of relationship in your data, and it’s essential to choose the right one for your analysis to ensure accurate results.
Calculating the Correlation Coefficient
The process for calculating the correlation coefficient depends on the type of correlation being calculated. Here, we will illustrate the process for calculating the Pearson coefficient, the most commonly used type.
The Pearson correlation coefficient (r) is calculated using the following formula:
r = Σ [(xi – x̄)(yi – ȳ)] / [(n-1)sx sy]
Where:
- xi and yi are the individual sample points indexed with i
- x̄ and ȳ are the means of the x and y variables
- sx and sy are the standard deviations of the x and y variables
- n is the total number of data points
The steps to calculate the Pearson correlation coefficient are as follows:
- Calculate the Mean: Find the mean (average) of the x-variable and the y-variable.
- Calculate the Deviations: For each data point, find the deviation from the mean for the x-variable (xi – x̄) and the y-variable (yi – ȳ).
- Calculate the Standard Deviations: Find the standard deviation for the x-variable (sx) and the y-variable (sy). The standard deviation is calculated as the square root of the variance, which represents the average of the squared deviations from the mean.
- Multiply and Sum: For each data point, multiply the x-deviation by the y-deviation, and then sum these values.
- Divide: Finally, divide the result by the product of the standard deviations of x and y and (n-1), where n is the number of data points.
The resulting value will be between -1 and +1, with -1 indicating a perfect negative correlation, +1 indicating a perfect positive correlation, and 0 indicating no linear correlation between the variables.
It’s worth noting that statistical software or a calculator with statistical functions can simplify this process. In these cases, you would typically just need to input your data and specify that you want to calculate the coefficient.
Interpreting the Correlation Coefficient
Once the correlation coefficient has been calculated, it’s crucial to correctly interpret its value to understand the relationship between the variables. Here’s how it can be interpreted:
- Correlation Coefficient Value The coefficient ranges between -1 and +1. A value of +1 indicates a perfect positive correlation, a value of -1 indicates a perfect negative correlation, and a value of 0 suggests no linear correlation between the variables.
- Positive Correlation If the coefficient is a positive number, this indicates a positive relationship between the variables. As one variable increases, the other variable tends to increase as well.
- Negative Correlation If the coefficient is a negative number, it indicates a negative relationship between the variables. In this scenario, as one variable demonstrates an increase, the other variable tends to exhibit a corresponding decrease.
- Strength of Correlation The closer the absolute value of the coefficient is to 1, the stronger the linear relationship between the variables. When the coefficient is ±1, it signifies a flawless linear relationship between the variables. A correlation closer to 0 indicates a weaker linear relationship.
- No Correlation A correlation coefficient of 0 indicates the absence of a linear relationship between the variables.
Remember, correlation does not imply causation. A high correlation between variables doesn’t necessarily mean that changes in one variable cause changes in the other. There might be other factors at play, or the relationship could be coincidental. To establish causality, more robust statistical techniques or experimental designs are needed.
Limitations of the Correlation Coefficient
While the correlation coefficient is a powerful statistical tool, it is essential to understand its limitations to avoid misinterpretation of results. Here are some key limitations:
- Correlation Does Not Imply Causation A common misconception is assuming that a high correlation implies that one variable causes changes in the other. While correlation measures the strength and direction of a relationship, it does not establish a cause-and-effect relationship.
- Linearity Assumption The correlation coefficient only measures the strength and direction of a linear relationship between two variables. If the relationship is curvilinear, the coefficient may understate the strength of the relationship.
- Outliers Correlation is sensitive to outliers. A single outlier can significantly alter the value of the coefficient, making it either significantly higher or lower than the true correlation.
- Homoscedasticity The coefficient assumes that the variance of the variables is constant across all values. If this assumption is not met (heteroscedasticity), then the coefficient may not accurately represent the relationship between variables.
- Measurement Error If there is significant measurement error in the variables, this can attenuate the correlation coefficient, leading to an underestimation of the strength of the relationship.
- Restricted Range If the range of values used in calculation is restricted or truncated, the correlation coefficient may underestimate the strength of the relationship. For example, if the variables have a strong relationship only over a specific range of values, a coefficient calculated over a wider range may not accurately reflect this relationship.
Remember, careful attention should be given to these limitations when interpreting the results. It’s often necessary to use other statistical methods in conjunction with correlation to fully understand the relationship between variables.
Examples of Correlation Coefficient
The correlation coefficient is frequently used in various fields, from finance and economics to social sciences and health studies. Here are a few illustrative examples:
- Investment Portfolio Diversification In finance, the correlation coefficient is used to measure how different investments in a portfolio move in relation to each other. For instance, if two stocks have a coefficient close to -1, they would move in opposite directions, providing diversification benefits.
- Market Research In market research, a company might find a high positive correlation between customer satisfaction and repeat purchases. This might be interpreted as satisfied customers being more likely to make repeat purchases.
- Health Studies In health studies, researchers might find a high positive correlation between smoking and lung cancer. While it’s important to remember that correlation does not imply causation, such a finding could be used as a basis for further research into potential causal relationships.
- Economics In economics, correlation coefficients can be used to understand the relationship between variables such as unemployment rates and inflation. Economists may find a positive correlation between these two variables, indicating that when inflation rises, unemployment also tends to increase.
- Education In the field of education, a researcher may find a high positive correlation between the number of hours spent studying and the scores on a test.
Remember, these examples represent simplified scenarios. In real-world research, correlations typically form a component of more intricate statistical analyses, which consider multiple factors simultaneously. It is a useful tool, but it should be used carefully, considering its limitations and the context of the analysis.
FAQs
A correlation coefficient of 0 means that there is no linear relationship between the variables. It does not imply that there is no relationship at all, as there could be a non-linear or other type of relationship present.
No, the correlation coefficient cannot provide direct information about causation. While correlation measures the strength and direction of the relationship between two variables, it does not establish causation. Correlation merely indicates that a statistical association exists between the variables, but it does not reveal the underlying cause-and-effect relationship. Causation requires further investigation, including experimental studies, control of confounding factors, and consideration of alternative explanations, to establish a causal relationship between variables.
A correlation coefficient of -1 indicates a perfect negative or inverse linear relationship between the variables. It means that as one variable increases, the other variable decreases in a perfectly predictable manner. The variables are said to have a strong negative correlation, and their movements are precisely opposite to each other.
The correlation coefficient can be calculated using different methods, with the most common being Pearson’s coefficient and Spearman’s rank coefficient. These methods involve computing the covariance and standard deviations of the variables.
About Paul
Paul Boyce is an economics editor with over 10 years experience in the industry. Currently working as a consultant within the financial services sector, Paul is the CEO and chief editor of BoyceWire. He has written publications for FEE, the Mises Institute, and many others.

Further Reading
 Adjusted Gross Income - Adjusted gross income refers to an individual's total income from all sources, minus specific deductions and exemptions, and serves as…
  Price Gouging: Definition & Examples - Price gouging is where the seller increases the prices of their goods or services to a level considered unreasonable and…