Table of Contents ![]()
Consumer Surplus: Graph, Examples & How to Calculate
What is a Consumer Surplus
A consumer surplus is the difference between the amount that consumers are willing and able to pay for a product or service, and the actual price they end up paying. For example, if a consumer is willing to pay $5 for a Dunkin’ Donut, but they only pay $3 for it, their consumer surplus is $2.
The consumer surplus measures the extra benefit that a consumer receives beyond what they would be willing to pay. Whenever a consumer pays less than their maximum willingness to pay, the difference is considered a consumer surplus.
Key Points
- The consumer surplus is the gap between what the consumer is willing to pay and what they actually pay.
- If the consumer is willing to pay $5 for a good, but pays $3 – the surplus is the difference which is $2.
- It represents the net benefit a consumer receives from purchasing a good or service.
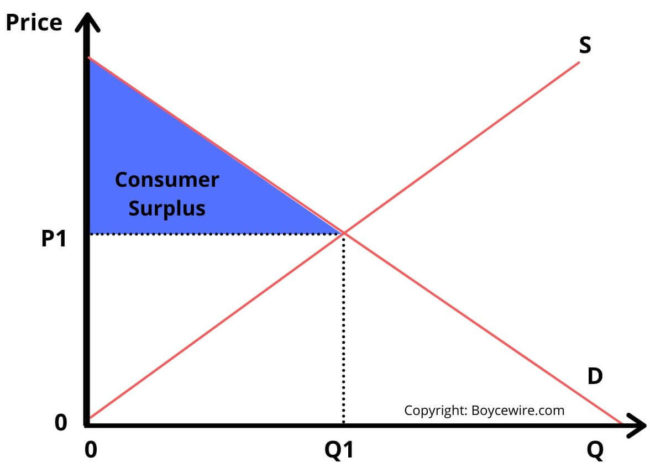
To measure the consumer surplus, we calculate the area where supply and demand intersect. Take a look at the graph below. Where P1 and Q1 align is where supply and demand intersect. The area above this intersection is the consumer surplus, while the area below the curve represents the producer surplus.
Consumer surplus is closely related to marginal utility, which represents the additional satisfaction a consumer gains from consuming one more unit of a good or service. As the marginal utility decreases towards zero, it indicates that the consumer’s willingness to purchase the good or service also decreases. At this point, the consumer surplus is reduced to zero, meaning that there is no longer any benefit gained from consuming additional units.
How to Calculate Consumer Surplus
To calculate the consumer surplus, there is a necessary clarification to make. Consumer surplus, on an individual level, represents the contrast between what a consumer is willing and capable of paying and what they ultimately pay. To determine this value, we can use the formula below:
Consumer surplus = maximum price willing to pay – actual price
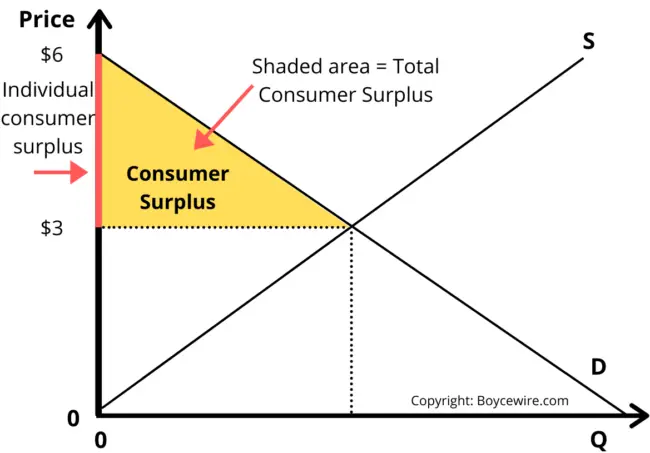
Looking at the chart, this just looks at the price difference without considering the overall supply and demand of the product. In other words, it doesn’t look at the wider economy.
So when calculating consumer demand, we are referring to the overall consumer surplus, not just on an individual basis. To explain, we are looking at the total shaded area, rather than just the vertical line.
To calculate consumer surplus, let us take an example.
Example of Consumer Surplus
Let’s say there are doughnuts on sale for $3. In turn, 1,000 are sold at that price. The maximum any one consumer would pay is $6. This willingness to pay starts to decline along the demand curve until it reaches supply.
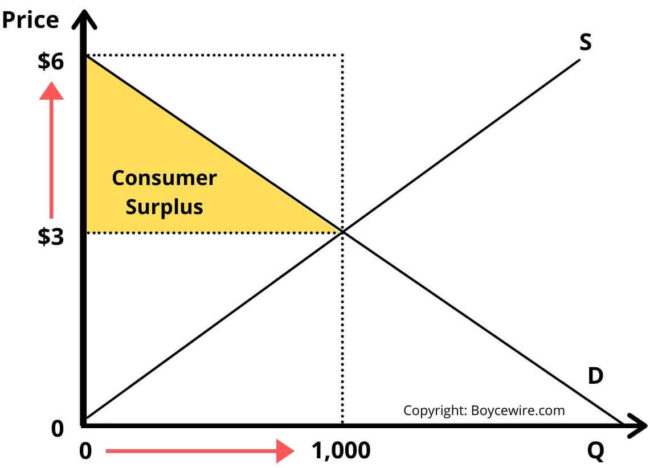
The area of the consumer surplus is the triangle above this line. In turn, we can capture the surplus of all consumers. We do so by working out the area of this triangle,
In this case, it would be 1,000 (quantity sold) x ($6 (the maximum willingness to pay) – $3 (actual price) x 0.5 (as it’s a triangle) = 1,000 x 3 x 0.5 = 1,500.
Consumer and Producer Surplus
A consumer surplus refers to the difference between the maximum a consumer would be willing to pay, versus the actual market price. The producer surplus contrasts with this. It refers to the minimum a producer would be willing to sell for and the amount it actually sells at. In other words, it is just a fancy word for profit.
The producer surplus can be calculated using the formula:
Total revenue – total cost = producer surplus
Importance of Consumer Surplus
The consumer surplus refers to the utility that consumers receive. In other words, people are willing and able to pay more, so obtain utility from making the transaction. This is because they value the good more highly than what they actually pay.
If their willingness to pay is less than the price of the product, then the transaction does not take place. So whenever a product is brought, there is a consumer surplus.
This is important because every transaction has a consumer surplus. However, those whose maximum willingness to pay is the same as what they pay; do not create a consumer surplus.
With that said, consumer surplus is important because not all consumers will purchase the product. Those with a large surplus will come back and buy again. This is because the price they pay is much lower than what they value the product.
On the surface, it may seem like businesses would want to get rid of the consumer surplus. After all, the business is losing out on potential profits. In part, this is what some businesses do through various forms of price discrimination. However, this isn’t always feasible.
In such situations, consumer surplus can be seen as a good thing, because consumers will keep coming back as they receive a greater benefit than they pay.
FAQs
To find the consumer surplus on a graph, we calculate the area between the price and where this intersects on the supply and demand curve. This area represents the additional value or benefit that the consumer gains from purchasing a good or service at a price lower than their maximum willingness to pay.
The consumer surplus is a good thing because it indicates that consumers are happy to purchase the product. If there was no consumer surplus, the consumer would receive no utility from purchasing the good or service. Therefore, a transaction would not take place.
A consumer surplus is defined as the gap between what consumers are able and willing to pay, and the actual price paid.
No, consumer surplus and producer surplus are not equal. They represent two different areas on a supply and demand graph, with consumer surplus representing the area above the equilibrium price and below the demand curve, while producer surplus represents the area below the equilibrium price and above the supply curve.
About Paul
Paul Boyce is an economics editor with over 10 years experience in the industry. Currently working as a consultant within the financial services sector, Paul is the CEO and chief editor of BoyceWire. He has written publications for FEE, the Mises Institute, and many others.

Further Reading
 Price Floor: Definition, Examples & Effects - A price floor is a minimum price set on goods and services usually determined by the government. This makes it…
  Gross National Income Definition - GNI, or Gross National Income, is the total value of goods and services produced by a country's residents, including income…
  Black Market - A black market is an illicit market where goods, services, or currencies are exchanged in violation of legal regulations.