Unit Elastic: Definition, Formula & Examples

What is Unit Elastic?
Unit elastic demand occurs when the percentage change in quantity demanded is equal to the percentage change in price. In other words, changes in price equally reflect changes in demand.
This unique scenario has significant implications for businesses and policymakers, as it affects pricing strategies, total revenue, and economic policy decisions.
Unit elastic demand is also known as unitary elasticity and is a type of elasticity of demand, which measures the percentage change in quantity demanded or supplied in response to a percentage change in price. The main other types include inelastic demand and elastic demand.
Key Points
- Unit elasticity refers to a situation where the percentage change in quantity demanded or supplied is equal to the percentage change in price.
- It represents a point of balance in market dynamics, where total revenue remains constant.
- Unit elasticity lies between elastic and inelastic demand or supply.
- The calculation of unit elasticity involves using the formula E = ΔQ/ΔP * (P/Q), where E represents elasticity, ΔQ is the change in quantity, ΔP is the change in price, P is the initial price, and Q is the initial quantity.
Understanding Unit Elastic Demand
Unit elastic demand is a specific case of price elasticity of demand where the percentage change in the quantity demanded of a good or service is equal to the percentage change in its price. In other words, the price elasticity of demand (PED) is equal to 1:
PED = (% change in quantity demanded) / (% change in price) = 1
Characteristics include:
- Proportional response: When the price of a good or service increases, the quantity demanded decreases by the same proportion, and vice versa. This means that a 10% increase in price will lead to a 10% decrease in quantity demanded, or a 15% decrease in price will result in a 15% increase in quantity demanded.
- No change in total revenue: With unit elastic demand, any change in price is matched by an equal and opposite change in the quantity demanded. As a result, the total revenue (price multiplied by quantity) remains unchanged. This is a unique characteristic of unit elastic demand, as other elasticities of demand will lead to changes in total revenue.
- Balanced effect on consumers and producers: Unit elastic demand represents a balance between the interests of consumers and producers. Price increases do not result in a loss of revenue for producers, while price decreases do not lead to significant gains for consumers.
Understanding the concept of unit elastic demand is essential for businesses and policymakers, as it provides insights into the dynamics of consumer behavior and the potential effects of price changes on the market.
Examples of Unit Elastic Demand
In reality, it is rare to find pure examples of unit elastic demand, as the relationship between price and quantity demanded tends to be more complex. However, certain goods and services may exhibit unit elastic demand under specific circumstances. Here are some examples:
- Essential goods with multiple alternatives Products that are considered essential, but have multiple close substitutes, can sometimes display unit elastic demand. When the price of such a product increases, consumers may switch to a substitute product in equal proportion, leading to a proportional decrease in the quantity demanded.
- Public transportation In some cases, public transportation services can exhibit unit elastic demand. If the fare for a bus or subway ride increases, the number of riders may decrease proportionately, as some commuters switch to alternative modes of transportation like carpooling, cycling, or walking.
- Certain types of entertainment The demand for certain forms of entertainment, like movie tickets or streaming services, can also be unit elastic. For instance, if the price of a movie ticket increases, some moviegoers might proportionally reduce their visits to the theater, opting for alternative forms of entertainment such as streaming services.
- Specific price ranges Unit elastic demand can also be observed within specific price ranges for certain products. For example, a product may exhibit inelastic demand at lower price levels but become unit elastic as the price increases beyond a certain point.
It is important to note that the examples provided above are only illustrations, and the actual price elasticity of demand for these goods and services may vary depending on various factors such as consumer preferences, income levels, and market conditions.
Factors Affecting Unit Elastic Demand
Several factors can influence the likelihood of a good or service exhibiting unit elastic demand. Understanding these factors can help businesses and policymakers make more informed decisions regarding pricing and supply strategies. Some key factors include:
- Availability of substitutes The presence of close substitutes for a good or service can increase the likelihood of unit elastic demand. When consumers have multiple alternatives, they are more likely to proportionally adjust their consumption based on price changes.
- Degree of necessity The level of necessity associated with a good or service can also influence its price elasticity of demand. Essential goods and services may be less responsive to price changes, while non-essential or luxury items may exhibit greater price sensitivity.
- Consumer preferences and habits The preferences and habits of consumers can play a significant role in determining price elasticity. If consumers are highly loyal to a particular brand or product, they may be less likely to adjust their consumption in response to price changes, making unit elastic demand less likely.
- Market competition The level of competition within a market can impact the likelihood of unit elastic demand. In highly competitive markets, businesses may be more inclined to adjust their prices in response to market conditions, making it more likely for goods and services to exhibit unit price elastic demand.
- Time horizon The time frame under consideration can also influence the elasticity of demand. In the short term, consumers may be less responsive to price changes due to factors such as habit or inconvenience. However, over the long term, consumers may be more likely to adjust their consumption patterns in response to price changes, increasing the likelihood of unit elastic demand.
- Income levels The income level of consumers can also impact the likelihood of unit elastic demand. Higher-income consumers may be less sensitive to price changes, as they can more easily absorb the additional cost. Conversely, lower-income consumers may be more sensitive to price changes, making unit elastic demand more likely.
It is important to note that the actual impact of these factors on the price elasticity of demand for a particular good or service will depend on the unique characteristics of the market and the specific product or service in question.
Calculating Unit Elastic Demand
Unit elastic demand occurs when the percentage change in quantity demanded is equal to the percentage change in price. This means that the price elasticity of demand (PED) is equal to 1. To calculate unit elastic demand, you can use the following formula:
Price Elasticity of Demand (PED) = (% Change in Quantity Demanded) / (% Change in Price)
For a good or service to exhibit unit elastic demand, PED must equal 1. To determine the percentage changes in quantity demanded and price, you can use the following calculations:
- % Change in Quantity Demanded = (New Quantity Demanded – Old Quantity Demanded) / Old Quantity Demanded
- % Change in Price = (New Price – Old Price) / Old Price
Let’s look at an example to illustrate the calculations:
Suppose the price of a product decreases from $10 to $9, and as a result, the quantity demanded increases from 100 units to 110 units. First, calculate the percentage changes in quantity demanded and price:
% Change in Quantity Demanded = (110 – 100) / 100 = 0.1 or 10%
% Change in Price = (9 – 10) / 10 = -0.1 or -10%
Now, calculate the price elasticity of demand:
PED = (10%) / (-10%) = -1
Since the PED equals -1 (ignoring the negative sign), the demand for this product is unit elastic. This means that a 10% decrease in price led to a 10% increase in quantity demanded.
It is important to note that price elasticity of demand can vary along the demand curve. Therefore, it is necessary to re-calculate PED when there are significant changes in price or other factors that could influence demand.
Unit Elastic Demand Graph
A unit elastic demand graph visually represents the relationship between price and quantity demanded when price elasticity of demand (PED) is equal to 1. In other words, the graph illustrates how a percentage change in price leads to an equal percentage change in quantity demanded.
To create a unit elastic demand graph, follow these steps:
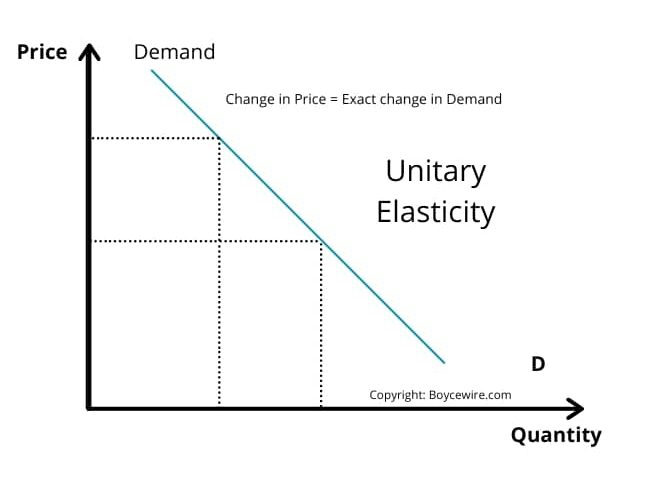
- Draw two axes: Label the horizontal axis as “Quantity” and the vertical axis as “Price.” These axes represent the quantity demanded of a good or service and its corresponding price.
- Plot the demand curve: The demand curve slopes downward from left to right, indicating that as the price of a good or service decreases, the quantity demanded increases. For a unit elastic demand curve, the slope of the curve will be such that the percentage change in quantity demanded is equal to the percentage change in price, resulting in a PED equal to 1.
- Identify unit elastic points: Along the demand curve, there will be specific points where PED equals 1. These points represent unit elastic demand. To identify these points, calculate the price elasticity of demand using the formula mentioned earlier:
Price Elasticity of Demand (PED) = (% Change in Quantity Demanded) / (% Change in Price) - Highlight the unit elastic region: Once you have identified the points where PED equals 1, you can highlight the region of the demand curve that represents unit elastic demand. This region may not encompass the entire demand curve, as the price elasticity of demand can vary along the curve.
In summary, a unit elastic demand graph visually demonstrates the relationship between price and quantity demanded when the price elasticity of demand is equal to 1. By plotting the demand curve and highlighting the unit elastic region, you can better understand how changes in price affect the quantity demanded for goods or services with unit elastic demand.
FAQs
Unit elasticity is significant because it represents a point of balance in market dynamics. When demand or supply is unit elastic, a change in price leads to an equivalent proportional change in quantity, resulting in constant total revenue. Understanding this concept helps businesses and policymakers make informed decisions regarding pricing strategies, revenue forecasting, and market equilibrium analysis.
Unit elasticity lies between elastic and inelastic demand. In elastic demand, the percentage change in quantity is greater than the percentage change in price, resulting in a more than proportional response to price changes. In inelastic demand, the percentage change in quantity is less than the percentage change in price, indicating a less than proportional response. Unit elasticity, on the other hand, occurs when the percentage change in quantity is equal to the percentage change in price.
Unit elasticity is calculated using the formula: E = ΔQ/ΔP * (P/Q), where E represents elasticity, ΔQ is the change in quantity, ΔP is the change in price, P is the initial price, and Q is the initial quantity. If the calculated elasticity value is equal to 1, it indicates unit elasticity.
There are several examples of goods that tend to exhibit unit elastic demand, including gasoline, certain food items (such as bread or milk), and basic household goods. These goods often have readily available substitutes, allowing consumers to adjust their consumption levels in response to price changes proportionally.
About Paul
Paul Boyce is an economics editor with over 10 years experience in the industry. Currently working as a consultant within the financial services sector, Paul is the CEO and chief editor of BoyceWire. He has written publications for FEE, the Mises Institute, and many others.

Further Reading
 Embargo Definition and Examples - An embargo is a government-imposed restriction on trade or economic activity with a specific country or group of countries.
  Discounted Payback Period - The discounted payback period is the length of time required for an investment to recoup its initial cost, considering the…
  Net Present Value: Definition, Formula & Example - Net Present Value (NPV) is the total value of future revenues, subtracted against any cash outflows during the same period.