Market Equilibrium: What it is & Graph
What is a Market Equilibrium
Market equilibrium occurs when demand and supply meet. In other words, supply fully meets demand. At this point, producers of a good sell exactly how much they produce and consumers are buying exactly how much they want. Most importantly, this comes at a price that both parties agree.
As producers and consumers are perfectly satisfied with the price, both parties produce and consume the exact same amount. Therefore, as the price is agreeable, it tends not to move from this equilibrium point. Consumers have little incentive to reduce consumption as they are happy that the goods represent value for the price.
Similarly, suppliers have little incentive to increase or reduce its prices. By increasing them, it will lose customers, thereby affecting profitability. Equally, by reducing them, it may gain customers, but lose precious profit margins, which again, will affect profitability. At the market equilibrium, it is seen that the producer also maximises their profits.
Key Points
- The Market Equilibrium is where supply and demand meet.
- When there is a market equilibrium, there is no excess supply, and no excess demand, so the market is allocatively efficient.
- When supply does not equal demand, the market is knwon to be in ‘disequilibrium’.
Both parties are incentivized to keep prices, and supply and demand at the same point. However, economics is not so straight forward and there are a large number of variables that can alter and affect this equilibrium. For instance, consumer preferences may simply change, or there is an increase in competition. This could lead to supply, demand, and prices to change. In turn, this can create excess demand or excess supply, and therefore lead to market disequilibrium.
For example, when the price of a good is higher than the market equilibrium, demand falls and supply increases – meaning an excess of supply. Equally, when prices fall below the market equilibrium, demand increases and supply falls – creating an excess of demand. However, the idea of supply and demand is that these forces naturally bring the market back toward market equilibrium. When prices are high, there’s an excess supply – so producers look to lower prices back to equilibrium. At the same time, when there is excess demand, suppliers increase prices to capture this and in turn increase supply. Once again, bringing the market back to equilibrium.
Market Equilibrium Graph
The market equilibrium is where supply and demand intersect at a specific price. This can be seen on the graph below.
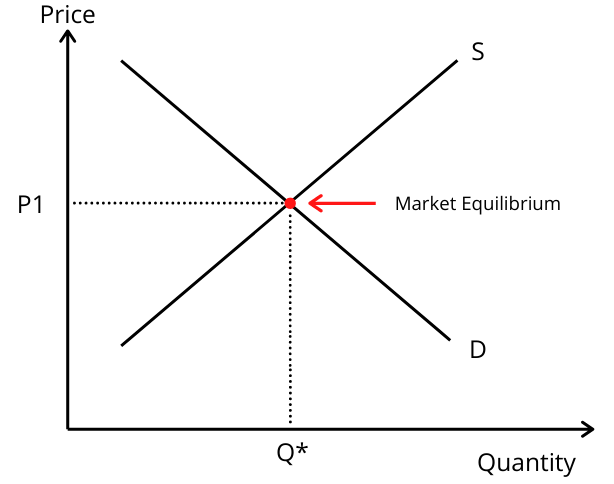
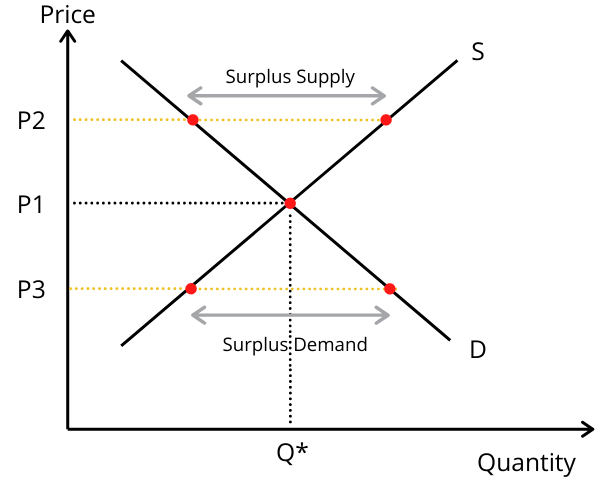
If the price is outside of the equilibrium, it can lead to either an excess in supply or an excess in demand. This is because as prices increase, demand falls as consumers are unable or willing to pay a higher price for the good. At the same time, suppliers are more willing to produce goods to market at higher prices, so overproduce – thereby creating an excess supply to the market.
There is also the case of excess demand. This is where prices fall below the equilibrium point. At this point, consumers increase the demand for the good because it is now cheaper. For instance, a chocolate bar that was $1 and is now 50 cents, will see an increase in demand as a result – assuming all the other chocolate bars stay the same price. So when prices are below the equilibrium point, there is an excess demand because there is more demand than suppliers are able or willing to supply at.
Changes in Market Equilibrium, Supply and Demand
Shift in Demand
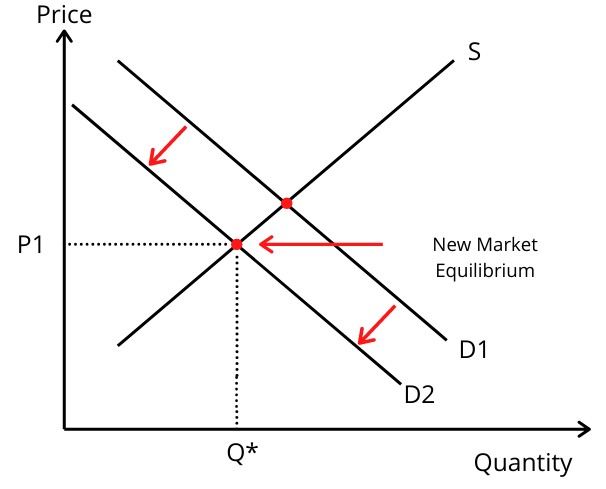
Often, a number of variables push the market out of equilibrium. For example, a superior-good may come along, which reduces consumer demand. If we look at the iPhone, this usually happens year on year as the new and more advanced edition comes out. Each year, the demand for the previous version will fall as consumers shift their demand to the new model.
In turn, this results in the demand curve shifting to the left, which creates a new equilibrium point whereby the price, demand and supply are all lower as a result.
1. Changing Consumer Trends
Consumers will frequently change their shopping habits. This could be due to the seasons, for instance, more ice cream is sold during the summer. It could also be due to word-of-mouth where consumers discover a superior-good or product. Perhaps advertising was more aggressive, so consumers became more aware.
No matter the cause of changing consumer trends, it can create a shift in the equilibrium. For goods that see an increase in demand as a result, the demand curve will shift right. So that means prices rise, demand rises, and so too does supply. When these changes negatively affect consumer demand, the demand curve will shift to the right – meaning lower prices, reduced supply, and reduced demand.
2. Changes in Disposable Income
Consumer’s disposable incomes can change year on year. Some may lose their job, whilst others may see their pay fall behind the rate of inflation. In such a situation, consumers’ disposable income is negatively affected and they will be unable to afford the same number of goods they have become accustomed to. At the same time, their preferences may also change. Instead of buying more premium brands, they may switch to basic low-thrill brands. In turn, the demand curve will shift to the left as demand, price, and supply all fall in line with the new equilibrium. However, for low-thrill brands, the demand curve may shift to the right as demand for these cheaper products increases.
Alternatively, disposable incomes may increase – perhaps because of favorable economic conditions. This means that consumers have more money to spend on more premium goods. So the market equilibrium for premium goods would see the demand curve shift to the right as demand, prices, and supply increase. However, as consumers shift away from low-thrill goods, they will see a shift in the demand curve to the left as demand, prices, and supply all fall for these.
3. Interest Rates
A significant number of consumers will have outstanding mortgage payments – so a higher rate will take up a greater proportion of their income. Rather than paying $1,000 a month, those repayments may increase to $1,500 per month – thereby representing a fall in the consumers disposable incomes.
Credit also becomes more expensive, so taking out monthly loans will also drain disposable incomes. This might be relevant for consumers who take out credit to buy a car, pay for groceries, or pay their monthly bills. It leaves them with a lower level of disposable income to spend on other goods and services. This has the effect of suppressing demand and shifting the demand curve to the left.
4. Changing Price of a Substitute Good
If the price of a substitute good increases, those consumers who are more price-sensitive may switch over to a cheaper alternative – thereby shifting its demand curve to the right. For example, the price of a PlayStation may increase by $100, whilst the price of an Xbox stays the same. Consumers will react by shifting demand away from PlayStation and towards Xbox.
With regards to Xbox, this will shift the demand curve to the right as there is an increase in demand. By contrast, the PlayStation will see a decrease in demand, with its demand curve shifting to the left.
Shift in Supply
There is also the case of a shift in supply. This might occur in agricultural markets. For example, a bountiful harvest may mean that there is an increase in supply. As a result, prices fall in order to attract more customers, which pushes the supply curve to the right. In turn, prices are lower, the quantity supplied is higher, and there is also more demand as a result.
1. Interest Rates
A change in the interest rate can have numerous effects throughout the economy. For instance, if interest rates go up, it creates an additional cost to businesses with outstanding debt. That additional cost makes it more expensive to produce their goods, which can affect supply as businesses cut back on production costs. This has the effect of moving the supply curve to the left.
2. Change in Cost of Production
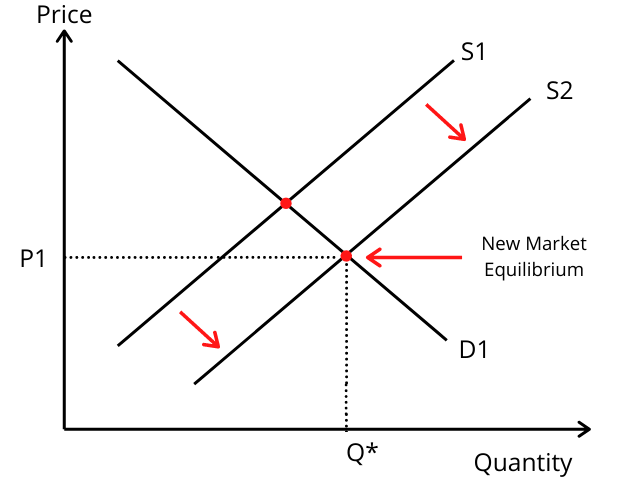
Changes in the cost of production could force producers to increase or decrease supply. For instance, a car manufacturer may see raw materials such as steel and glass increase in price. As a result, they are unable to afford as many raw materials to build vehicles as they would previous – meaning the firm has to reduce its supply to market. This would then shift the supply curve to the left.
The price of the good is the same, but the producers have reduced the quantity supplied. This then creates excess demand because the price has remained the same, so demand has also remained the same. The only variable that has changed is supply – which has created a new equilibrium point. This is where the new supply curve intersects the demand curve.
If we take an illustration, we can see on the graph below the impact this has. Initially, quantity moves from Q1 to Q*. However, at this point, there is excess demand. In order to bring this back into equilibrium, producers should raise prices which will in turn help increase supply. This will reduce demand from the original market equilibrium but will represent the new best scenario for both consumers and suppliers.
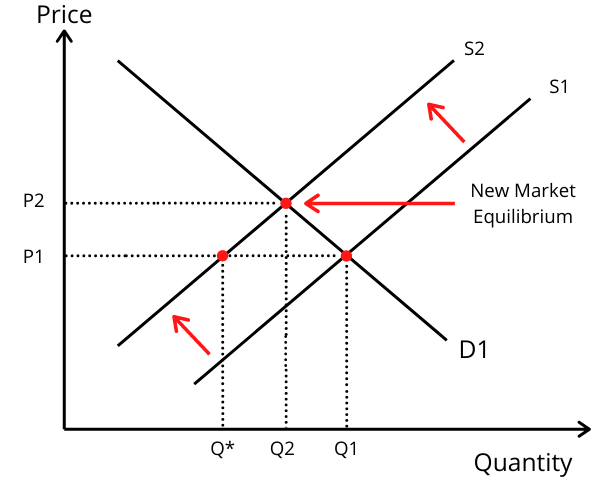
3. Increase in Productive Efficiency
Businesses constantly look to increase the efficiency of their production. This might come through new processes, investment in machinery, or management efficiencies. By looking at how the business can become more efficient, it means that fewer resources are needed to make the same number of goods. For example, a factory may only need one hour to produce 1,000 units as opposed to the two hours it previously took.
In turn, increases in efficiency allow the company to use those resources in a different fashion. It can choose to increase the supply of its goods as it can produce twice as many units using the same resources. This shifts the supply curve to the right. There is now a greater level of supply in the market. However, when prices and demand stays the same, this will lead to an excess level of supply. To reach the new equilibrium point, prices must fall to increase demand and bring it back in align with supply.
4. Increased Competition
When new competitors enter the market, there is an increase in supply. Not only is there supply for Company A, but now there is also supply from the new competitor, Company B. This causes the supply to increase and therefore shift to the right.
The increase in competition puts pressure on the existing firm to lower its prices to meet at the new equilibrium. As there is an increase in supply, there is also an excess of supply – meaning the firms have more goods than there are consumers to sell to. So in order to sell the excess supply, prices must be lowered, which brings us to the new equilibrium point where both supply and demand are higher than previously, but prices are lower. This is why competition can prove to be beneficial to the customer.
Market Disequilibrium
A market is in disequilibrium when it fails to align supply and demand. In other words, there is either an excess of supply, or, an excess of demand. For example, Company A produces widgets that sell for $5. At that price, it produces 100 widgets, but the demand for them is only 50. So in this case, the market is in disequilibrium because Company A is producing excess supply. In turn, the firm will either reduce its supply to meet demand, or, lower prices in order to capture extra demand.
In economics, markets frequently fall into disequilibrium. This is because like the water in the sea, it is constantly trying to find its level. Factors such as changing consumer trends, increased competition, and changes in income all play a factor in constantly shifting the equilibrium point – which means markets are usually left in disequilibrium for a time.
Over time, markets will shift between periods of excess supply and excess demand, trying to bring supply and demand in to equilibrium. We can illustrate this with the graph below.
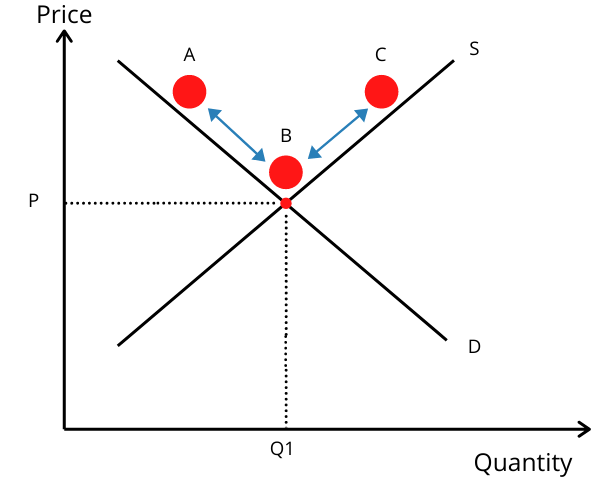
The ball is constantly moving between A and C, and meeting at the equilibrium point at B. This is a constantly moving process where supply increases and falls, demand increases and falls, and prices increase and fall.
FAQs on Market Equilibrium
Market equilibrium is where supply and demand intersect. In other words, the market is sufficiently supplied for. There is no excess demand, nor is there excess supply. It is allocatively efficient.
Markets will reach equilibrium on their own as businesses and consumers reach to changes in price. For instance, excess demand will be met with higher prices as the supplier increases production to meet this higher demand. At the same time, if prices are too high, consumers will go elsewhere until producers react by lowering prices. This then attracts consumers back and helps producers sell exactly the number of goods that they produce.
Market equilibrium is achieved by the relationships between prices, and supply and demand. So when there is an increase in demand, prices increase to allow producers to increase production and meet that demand through a higher level of supply.
About Paul
Paul Boyce is an economics editor with over 10 years experience in the industry. Currently working as a consultant within the financial services sector, Paul is the CEO and chief editor of BoyceWire. He has written publications for FEE, the Mises Institute, and many others.

Further Reading
 Human Development Index - The Human Development Index (HDI) is a composite measure that assesses a country's overall development based on indicators such as…
  Cartel - A cartel in economics is an organization or group of firms that collude to restrict competition and control market prices…
  Cluster Sampling - Cluster sampling is a sampling technique in which the population is divided into groups or clusters, and a subset of…