Confidence Interval: Definition, Formula & Examples
What is a Confidence Interval?
Statistical analysis is a powerful tool that guides researchers, scientists, and policymakers in decision making. At the heart of this analysis lies a fundamental concept known as the “Confidence Interval” (CI). A confidence interval provides a range of values, derived from a data sample, that is likely to contain the true population parameter.
Unlike a single point estimate, a confidence interval provides a range of possibilities, thereby giving a more comprehensive perspective on the uncertainty inherent in the estimation process. Confidence intervals are a key component of many statistical techniques and are widely used in everything from clinical trials in medicine to political polling.Key Points
- A confidence interval is a statistical range of values that provides an estimate of the true value of a population parameter, such as a mean or proportion.
- It is constructed using sample data and is based on the principle that different samples from the same population would yield slightly different estimates.
- The confidence level associated with a confidence interval represents the probability that the interval contains the true population parameter. Common confidence levels are 90%, 95%, and 99%.
Basics of Confidence Intervals
Before delving into the specifics of calculating and interpreting confidence intervals, it’s important to familiarize ourselves with the basic terminologies and concepts.
Basic Terminologies
- Population: This refers to the entire group that you’re interested in studying. For example, if you’re studying the average height of adult women in the US, the population would be all adult women in the US.
- Sample: A subset of the population that is used to gather data. It’s often not feasible to measure the entire population, so a sample is taken. If representative, it can provide a good estimate of the population parameter.
- Estimate: An approximation of a population parameter based on sample data.
- Population Parameter: A characteristic or measure of the population, such as a mean (average) or proportion.
Concepts of Confidence Level and Margin of Error
A confidence interval is defined by two main components: the confidence level and the margin of error.
- Confidence Level: The confidence level, usually expressed as a percentage (like 95%), reflects how certain we can be that the calculated confidence interval contains the true population parameter. If you were to repeat your sample many times, a 95% confidence level implies that 95% of the confidence intervals would contain the population parameter.
- Margin of Error: The margin of error provides a range around the estimate and is determined by the variability in your data (often the standard deviation), the size of your sample, and your chosen confidence level. The larger your margin of error, the wider your confidence interval, and the more uncertainty there is in the estimate.
These basic concepts lay the foundation for understanding confidence intervals. In essence, a confidence interval is a range of values, calculated from the sample data, which is likely to contain the true value of an unknown population parameter. The confidence level is the frequency (i.e., the proportion) of possible confidence intervals that contain the true value of their corresponding parameter. In the next section, we will explore how to calculate a confidence interval for a given set of data.
Calculating Confidence Intervals
A key aspect of using confidence intervals in statistical analysis is understanding how to calculate them. Here, we will go through the basic process for two of the most common scenarios: calculating a confidence interval for a mean and for a proportion.
1. Prerequisites
Before starting, it’s important to identify the following variables:
- Sample Size (n): The number of observations in your sample.
- Standard Deviation (σ or s): A measure of the amount of variation or dispersion of a set of values. If you know the standard deviation for the population, use σ. If not, you can use the standard deviation from your sample, denoted as s.
- Sample Mean (x̄) or Sample Proportion (p̂): The average or proportion of your sample.
- Z-score or t-score: These are values from a Z-distribution or a T-distribution, respectively, that correspond to your chosen confidence level. For large sample sizes (n > 30 as a rule of thumb), a Z-distribution can be used. For smaller samples, a t-distribution is used.
2. Step-by-Step Guide to Calculate a Confidence Interval
Here, we’ll discuss the step-by-step process of calculating the confidence interval for both a mean and a proportion.
Confidence Interval for Mean
Let’s say you’re trying to calculate a 95% confidence interval for a mean.
- Step 1: Identify your sample mean (x̄), standard deviation (s), and sample size (n).
- Step 2: Choose your confidence level. In this case, we’re using 95%.
- Step 3: Find the Z-score or t-score that corresponds to your chosen confidence level. For a 95% confidence level, the Z-score is approximately 1.96.
- Step 4: Calculate the standard error, which is the standard deviation divided by the square root of the sample size (s/√n).
- Step 5: Multiply the standard error by the Z-score (1.96*SE).
- Step 6: The confidence interval is then (x̄ – (1.96SE)) to (x̄ + (1.96SE)).
Confidence Interval for Proportion
The process for proportions is similar.
- Step 1: Identify your sample size (n) and sample proportion (p̂).
- Step 2: Choose your confidence level. Let’s stick with 95%.
- Step 3: Find the Z-score that corresponds to your chosen confidence level.
- Step 4: Calculate the standard error for the proportion, which is the square root of [(p̂ * (1 – p̂))/n].
- Step 5: Multiply the standard error by the Z-score.
- Step 6: The confidence interval is then (p̂ – (1.96SE)) to (p̂ + (1.96SE)).
3. Use of Statistical Software in CI Calculation
While these calculations can be done by hand, statistical software packages (like R, Python with its SciPy library, or SPSS) can easily perform these calculations and are typically used in practice, especially when dealing with complex data sets or more complicated statistical models. Regardless, understanding the principles behind these calculations is key to correctly interpreting the results.
Limitations and Misuse of Confidence Intervals
- Assumptions: Confidence intervals rely on certain assumptions. For example, constructing a confidence interval for a mean typically assumes a normal distribution. If these assumptions are not met, the resulting confidence intervals may be misleading.
- Sensitive to Sample Size: The width of the confidence interval is directly impacted by the size of the sample from which it is drawn. Small sample sizes can lead to wide, less precise intervals, while large sample sizes can yield narrow intervals, giving an illusion of precision that might not reflect other sources of error or bias in the data collection process.
- Confidence Level Misinterpretation: A 95% confidence interval does not mean that there’s a 95% probability that the true population parameter lies within the interval. Instead, it means that if we were to take repeated samples and compute a confidence interval from each sample, about 95% of these intervals would contain the true parameter.
- Single Sample Misconception: Confidence intervals are often misinterpreted as the range of values that could plausibly apply to a single observation. This is incorrect; they apply to the estimation of population parameters based on the sample data.
- Absolute Certainty: The end points of confidence intervals are not the definitive bounds for the population parameter. There’s still a 5% chance (for a 95% confidence interval) that the true population parameter lies outside the interval.
- Overlapping Intervals: The comparison of confidence intervals from different samples can be problematic. Overlapping confidence intervals don’t necessarily indicate that the difference between two means or proportions isn’t statistically significant.
- Confidence intervals provide valuable information, but misinterpreting them can lead to incorrect conclusions. For example, researchers may incorrectly claim non-significance based on overlapping intervals, potentially overlooking important findings. Or policymakers may interpret the bounds of a confidence interval as absolutes, leading to decisions that don’t account for inherent uncertainty.
1. Limitations of Confidence Intervals
2. Common Mistakes in Using Confidence Intervals
3. Dangers of Misinterpreting Confidence Intervals
Understanding these limitations and potential pitfalls can help researchers and professionals use confidence intervals more effectively and interpret them more accurately, leading to better decision-making and more reliable conclusions.
Examples of Confidence Intervals
1. Confidence Interval for Mean
Let’s say a researcher is studying the average height of adult males in a particular city. They gather a sample of 100 men from various regions of the city and measure their heights. The researcher finds the average (mean) height to be 175 cm, with a standard deviation of 10 cm.
Now, the researcher wants to estimate a 95% confidence interval for the true average height of all adult males in the city. Using the Z-score of 1.96 for a 95% confidence interval:
Standard Error (SE) = standard deviation / sqrt(sample size) = 10 / sqrt(100) = 1
Margin of Error (ME) = Z-score * SE = 1.96 * 1 = 1.96
So, the confidence interval is (mean – ME) to (mean + ME), or (175 – 1.96) to (175 + 1.96), which is 173.04 cm to 176.96 cm.
Therefore, the researcher can say with 95% confidence that the average height of all adult males in the city lies between 173.04 cm and 176.96 cm.
2. Confidence Interval for Proportion
In a different scenario, a polling agency conducts a survey on voter preferences for an upcoming mayoral election. They survey 1,000 eligible voters in the city and find that 600 of them plan to vote for Candidate A.
Here, the polling agency is interested in the proportion of all eligible voters in the city who prefer Candidate A. In this case, the sample proportion (p̂) is 600/1000, or 0.6.
The agency wants to estimate a 95% confidence interval for this proportion. Using the Z-score of 1.96:
Standard Error (SE) = sqrt[(p̂ * (1 – p̂))/n] = sqrt[(0.6 * 0.4)/1000] = 0.015
Margin of Error (ME) = Z-score * SE = 1.96 * 0.015 = 0.0294
So, the confidence interval is (p̂ – ME) to (p̂ + ME), or (0.6 – 0.0294) to (0.6 + 0.0294), which is 0.5706 to 0.6294.
Therefore, the polling agency can say with 95% confidence that the proportion of all eligible voters in the city who plan to vote for Candidate A lies between 57.06% and 62.94%.
FAQs
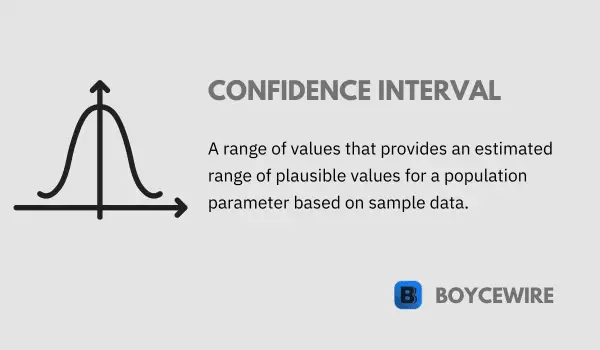
A confidence interval is a range of values that provides an estimated range of plausible values for a population parameter, such as a mean or proportion, based on a sample from that population.
The purpose of a confidence interval is to provide an estimate of the range within which the true population parameter is likely to fall. It quantifies the uncertainty associated with estimating population parameters from sample data.
Confidence intervals are typically calculated using statistical formulas or methods that take into account the sample size, variability of the data, and chosen confidence level. The most common methods include the z-score method for large samples and the t-score method for small samples.
The confidence level represents the probability that the true population parameter lies within the calculated confidence interval. For example, a 95% confidence level means that if we were to repeat the sampling process multiple times, we would expect the calculated intervals to contain the true population parameter in 95% of those repetitions.
About Paul
Paul Boyce is an economics editor with over 10 years experience in the industry. Currently working as a consultant within the financial services sector, Paul is the CEO and chief editor of BoyceWire. He has written publications for FEE, the Mises Institute, and many others.

Further Reading
 The Invisible Hand: Definition, Pros, Cons & Example - The invisible hand was first coined by Adam Smith who explained how the self-interest of the individual benefits the rest…
  Stagnation: Definition, Causes & Examples - In economics, stagnation is where a nation experiences an extended period of low economic growth.
  Fiscal Policy: Definition, Tools & Objectives - Fiscal policy refers to governments spending and taxation. So how much income it has coming in through taxes, and how…