Laffer Curve: What it is, Diagram & Criticisms
What is the Laffer Curve
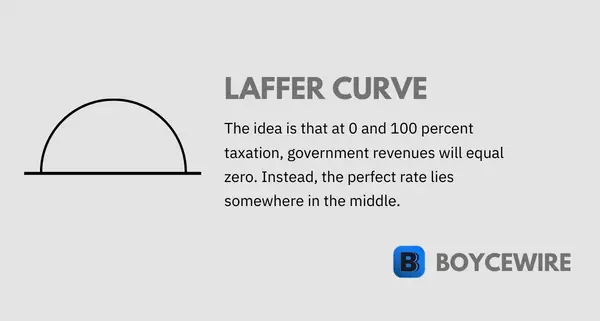
Originally developed by economist Arthur Laffer, the Laffer Curve illustrates the relationship between taxation and government revenue. It stimulates that at 100 percent tax, governments would receive no revenue as consumers would have no desire to pay it. Similarly, at 0 percent tax, government would simply receive no income from its citizens.
The Laffer curve was designed to determine the optimal level of taxation which would maximize government revenue. It helped economists understand why tax rises can have a detrimental effect on government revenue. Whilst it is logical that higher taxes would mean higher revenue – the Laffer curve disputed this commonly accepted belief.
The Laffer curve does not completely dispute that higher taxes mean higher revenue, but rather that at a certain point, higher taxes lead to diminishing returns. In other words, tax payers start to pay less tax. This may be because the rich leave the country, the middle class stay in lower tax brackets, or it creates a negative impact on employment.
Key Points
- The Laffer curve stipulates that higher taxes do not always mean higher revenue.
- Similarly, the Laffer curve states that lower taxes do not always mean lower revenue.
- The Laffer curve is not pro-taxes or anti-taxes, but demonstrates that too much tax or too little tax may negatively affect revenue.
The Laffer curve equally disputes the notion that lower taxes bring in higher revenue. Whilst it may bring in higher revenue when taxes are reduced from extortionately high levels such as 90 percent – it may have the opposite effect when taxes fall from say 20 to 18 percent. The concept is that the lower the existing tax rate, the greater impact a reduction in the tax rate may have.
For example, reducing the tax rate from 50 to 40 percent may help increase revenues as businesses return and individuals are happy to move into higher brackets. However, when the tax falls from 20 percent to 15 percent, it is unlikely to have the same positive impact. To demonstrate, let us now look at the Laffer curve diagram.
Laffer Curve Diagram
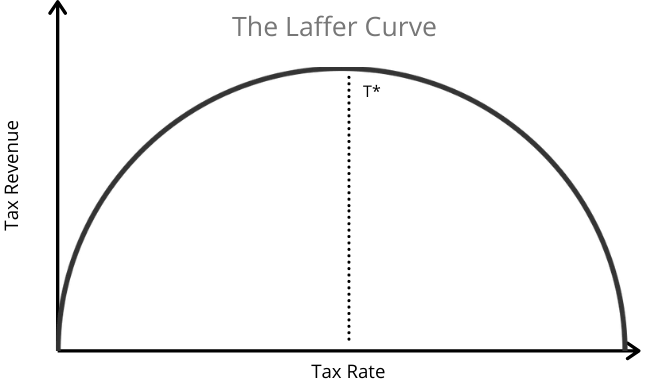
Looking at the diagram below, we can see that at a tax rate of 0 and 100, revenue is equal to zero. This is because when tax is at 100 percent, then nobody has an incentive to earn money and pay tax. Yet when the rate is at 0 percent, government naturally brings in no revenue.
The idea of the Laffer curve is that governments maximize their revenue when the tax rate is somewhere between 0 and 100. This isn’t necessarily at 50 percent, and will vary from country to country.
Understanding the Laffer Curve
The Laffer Curve looks at the two main effects within tax theory. The first is the arithmetic effect and the second is the economic effect. Let us look at them below:
- Arithmetic Effect
The Laffer curve expands on traditional arithmetic effect that is often associated with higher taxes. That is to say an increase in the tax rate by 5 percent would also increase revenue by an equal amount. For example, a 20 percent tax rate may bring in $1 million. The arithmetic effect would stipulate that if the tax rate was to increase by 10 percent (to 30 percent), then revenue would increase by an equal amount. In this example, it would increase revenue by $100,000.
This is a relative logical and straight forward assumption. However, raising and lowering taxes both have unforeseen consequences throughout the wider economy. This is why the Laffer curve also factors in the economic effect. - Economic Effect
Whilst the arithmetic effect stimulates that the tax rate and revenue increase in a linear fashion – the economic effect factors in the wider impact fiscal policy can have. For example, higher taxes can disincentivize business activity which actually decreases revenue. Businesses may move operations abroad or not invest so heavily. At the same time, businesses that move abroad also take jobs with them. So the tax receipts government would receive from employee contributions also diminishes.
At the same time, higher tax rates make alternatives more appealing. For example, businesses that face high tax rates may instead purchase fancy office suites and private jets. They may artificially increase expenditure on goods that add little value to its business proposition – purely because the cost is cheaper than paying the tax rate. For instance, if the tax rate was at 80 percent, a business would save 80 percent on whatever else it purchases – as it would otherwise go to the government in the form of taxes.
By contrast, lower tax rates make business investment more appealing. It also encourages employees to work more. For example, when faced with the opportunity to work over-time, employees may refuse if they only keep 50 percent of that salary, but accept if they get to keep 80 percent. Business will also invest more aptly with future profits in mind. If they are able to keep a higher percentage of their profits, they have a greater incentive for the investments to come off so they can reap the benefits.
Assumptions Behind the Laffer Curve
The Laffer Curve is a theoretical construct and thus is based on several key assumptions:
- One Tax Rate The Laffer Curve assumes a single tax rate for all income levels. In reality, many countries use a progressive tax system where the tax rate increases with income. The Curve does not account for how changes in tax rates at different income levels may affect overall revenue.
- Tax Revenue and Tax Rate Relationship The Laffer Curve assumes that tax revenue and tax rates have a parabolic relationship. This assumes that there is a tax rate at which revenue is maximized and any increase or decrease from this rate reduces revenue.
- Ceteris Paribus As with many economic models, the Laffer Curve operates under the assumption of ceteris paribus – all other conditions remain the same. This means it does not account for potential changes in factors such as overall economic activity, population growth, changes in spending behavior, or public sentiment towards taxation.
- Perfect Rationality The Laffer Curve also assumes that taxpayers will respond rationally to changes in tax rates. That is, when tax rates increase beyond a certain point, people will reduce their taxable income, either by working less, evading taxes, or finding tax loopholes.
- Instantaneous Response The model also assumes that taxpayers will react immediately to changes in tax rates. However, in reality, it could take time for individuals and businesses to adjust their behaviors in response to tax changes.
- No Government Spending Another implicit assumption is that the curve does not consider the impact of government spending. This ignores the fact that tax revenue is often used to fund public goods and services, which can have a significant impact on the economy.
While these assumptions allow for the simplification of complex economic relationships, they can limit the Curve’s accuracy and applicability in real-world scenarios. Therefore, while the Laffer Curve can serve as a useful conceptual tool for thinking about taxation and revenue, its predictions and conclusions should be interpreted with caution.
Laffer Curve Criticisms
1. Simplistic Single Tax Rate
In the modern world of today, there are a number of different taxes ranging from sales taxes, income taxes, corporate taxes, to land taxes – among others. The Laffer curve only demonstrates one specific tax rate, which in reality, wildly differs between types of tax. A change in income tax for high earners may have a subsequent effect on how they receive that income. For instance, some executives may instead receive shares instead – so they receive a greater income through capital gains.
The tax system is so complex that raising a rate of one tax can create an impact that may offset the benefits or negatives from reducing another. So by allocating a simplistic single tax rate, the Laffer curve overly simplifies the relationship between taxes.
2. Tax Cuts for the Rich
The Laffer curve stipulates that there is a ‘sweet spot’ for maximizing government revenue. As that spot is somewhat vague, there are many calls to give tax cuts for the rich – which could boost revenue through the economic effect. However, this is frequently criticized by commentators who dispute this. Yet the Laffer curve gives equal weight to the arithmetic effect which stipulates that higher taxes bring in higher revenue. It doesn’t dispute this, but rather at a certain tax rate, there can be diminishing returns.
3. Vague Ideal Tax Rate
Another criticism of the Laffer curve is that an ‘ideal’ tax rate is not stipulated. Instead, it is said to lie somewhere between 0 and 100. As the Laffer curve does not follow the traditional arithmetic effect whereby 10 percent increase in tax equals 10 percent increase in revenue – it is often used as a way to justify tax cuts. Yet these tax cuts do not always increase revenue – because the optimal level is higher than that rate. Instead, governments have to constantly change tax rates in order to find this optimal point – which itself is constantly changing.
4. Ideal Tax Rate Constantly Changes
The very nature of the world is chaos. Everything is constantly changing and so too is the nature of a nations economy. Today, it is not only affected by its own actions, but also those of other nations. We only need to look at the trade war between the US and China to see such an effect.
As a result of such chaos, the ideal rate of tax is never constant. The Laffer curve itself does not provide some kind of formula to calculate the perfect rate, so it is largely ineffective. How can a nation use the Laffer curve when the notion of an ideal tax rate is anywhere between 0 and 100? At the same time, this ideal rate constantly changes due to economic circumstances. For example, during a recession, it might be more effective to lower taxes. Equally, during an economic boom, it might be more effective to increase taxes.
5. Assumed Economic Self-interest
The Laffer curve stipulates that higher taxes result in lower revenues because corporations leave and employees work fewer hours. This has a firm logical basis, but not all have the same economic interests. For instance, employees may continue to work long hours because they want career progression and enjoy the work they do. Equally, firms may prefer to stay in countries with higher tax rates because they offer a more skilled workforce. Infrastructure may be superior and the cost of doing business may be lower. These other factors may continue to outweigh the additional increase in taxation.
FAQs
It is an important concept because it questions the original arithmetic concept that higher taxes = higher revenues. Whilst this can remain true in certain circumstances, the Laffer curve highlights that this is not always true due to the economic effects higher taxes bring. In turn, it has revolutionized fiscal policy.
The optimal tax rate in the Laffer curve depends on many factors and will change frequently over time and between nations. For some nations, the optimal rate may be 20 percent, whilst others it will be 30 percent. It all depends on how individuals react to higher rates and the economic environment at the time.
The concept of the Laffer Curve was originally created by economist Arthur Laffer in 1974. It is said that he originally wrote down the concept on a napkin to demonstrate the theory to Republicans.
About Paul
Paul Boyce is an economics editor with over 10 years experience in the industry. Currently working as a consultant within the financial services sector, Paul is the CEO and chief editor of BoyceWire. He has written publications for FEE, the Mises Institute, and many others.

Further Reading
 Deflation: Definition, Causes & Effects - Deflation can be caused from a number of factors. However, it should be noted that these factors alone may not…
  Division of Labor - The division of labor refers to the segmentation of tasks, so each person focuses on a specific part of the…
  Arbitrage - Arbitrage refers to the practice of exploiting price differences in different markets to make risk-free profits.