How is Inflation Measured?
How is Inflation Measured: The Consumer Price Index (CPI)
CPI is the most common measurement to calculate inflation, which is based upon a basket of goods. This is conducted through surveys of over 24,000 people across the country. Each quarter, their spending habits are recorded through an interview survey. In order to collect information on frequently used items, such as food, drink, and personal care; another 12,000 consumers are chosen. They keep a diary listing everything purchased during a two week period.
They are then asked to provide their spending habits every quarter over a two year period. This information is used to determine the importance or weight, of the item categories.
Weighting
The CPI uses the weighting of products by calculating shifting spending patterns. For example, ice cream may account for 0.5 percent of a family’s yearly spend. Therefore, an increase in the price of ice cream will account for a 0.5 percent increase in the overall rate of inflation.
For simplicity, let’s say every consumer buys 2 oranges and 4 bananas on an annual basis. For this example, oranges would be given a weighting of 33.33 percent. Bananas would receive a weighting of 66.66 percent.
If the price of oranges increases from $1 to $1.10, the inflation rate is 10 percent. This is then multiplied by its weighting. Which gives us a rate of 3.3 percent. Now if the bananas increase from $1 to $1.20, inflation is 20 percent. Given its weighting of 66.66 percent, this would take the weighted inflation to 13.2 percent. When we also include the inflation of the oranges, the overall rate comes to 13.2 percent + 3.3 percent = 16.5 percent.
What is Included in the CPI?
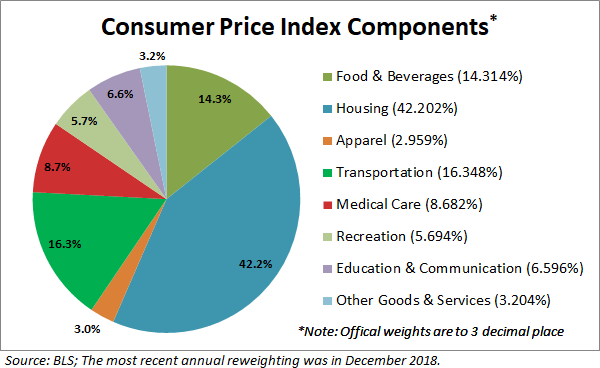
The CPI covers 200 categories, across eight major groups (food and beverages, housing, apparel, transportation, medical care, recreation, education and communication, and other goods and services). It covers over 80,000 items within these groups.
Every few years, the BLS will update the basket of goods. This is so that new consumer trends are accounted for. For example, radios may be removed, whilst iPhones are added.
In order to be relevant, these changes are necessary. However, they do partially impact on the inflation rate. Older items such as radios etc. tend to reduce in price. Comparatively, new items are more popular and are therefore more prone to inflation. So when new items are added, there is a tendency for the CPI to overstate inflation.
What and who are not Included in the CPI
The CPI does not include investment items, such as stocks, bonds, real estate, and life insurance because these items relate to savings, and not to day-to-day consumption expenses. However, rents are included, although that’s misleading. The price for such is likely to drop when there is a high vacancy rate. This occurs when interest rates are low, but house prices are rising.
Consumers will buy homes much more readily during an improving economy. At the same time, home prices fall when interest rates rise. As this happens, the demand for rental apartments increase. The costings, therefore, can work in contradiction to one another. Whilst the CPI shows a rise, there may, in fact, be a fall in homeownership.
The CPI reflects spending patterns for each of the two population groups: all urban consumers and urban wage earners and clerical workers.
The urban consumer group represents about 93 percent of the total U.S. population. It is based on the expenditures of almost all residents of urban or metropolitan areas, including professionals, the self-employed, the unemployed, and retired people, as well as urban wage earners and clerical workers.
Not included in the CPI are the spending patterns of people living in rural nonmetropolitan areas, those in farm households, people in the Armed Forces, and those in institutions, such as prisons and mental hospitals.
Hedonic Quality Adjustment in the CPI
The hedonic quality adjustment attempts to factor in quality within the CPI. As technological progress is made, some items become of greater value. However, the CPI only factors in price increases rather than such qualitative factors.
The hedonic quality adjustment aims to account for changing quality. It refers to the adjustment of prices to consider characteristic changes due to innovation or new products.
The word ‘hedonic’, is of Greek origin. Its meaning translates to ‘relating to pleasure’. Consumers purchase goods for the pleasure they receive. In economic terms, this is referred to as utility.
For example, an average consumer would receive greater utility from an iPhone XR, as opposed to a Nokia 3320. However, this may change when factored with price. The hedonic adjustment, therefore, tries to calculate the value consumer put on this greater level of utility. This may include camera quality, number of features, and battery size.
As you can image, this is very difficult to estimate. However, these adjustments are calculated through regression analysis. The hedonic regression model estimates the value of the utility derived from each characteristic. For example, if the battery life is improved, it would be considered with inflation.
How the Hedonic Quality Adjustment is Calculated
To illustrate the mechanics of a hedonic quality adjustment, it helps to begin with the generalized form of the hedonic regression equation:
Where the dependent variable, lnP, is the natural log of price, ß are the coefficients estimates of the independent variables (Xk), and e is the error term. The coefficients are a measure of the percentage change in price associated with a unit change in the characteristic. If the item being modeled is men’s shirts, the independent variables might be sleeve length and fiber composition; a simplified version of a hedonic model for men’s shirts might be:
Here all shirts are either short sleeve or long sleeve and either cotton/poly or 100% cotton. After doing the statistical processing BLS might estimate that ß1 = 0.15 and ß2 = 0.25. This indicates that a long sleeve shirt is 15 percent more valuable than a short sleeve one and that a 100% cotton shirt is 25 percent more valuable than a cotton/poly blend shirt.
If the BLS data collector is forced to replace a short-sleeve cotton/polo shirt in the CPI sample with a long sleeve 100% cotton shirt, the CPI would attribute 40 percent of their price difference to increased shirt value (15 percent for sleeve length and 25 percent for fiber). The CPI would treat the remaining 60 percent of the price difference as pure chance.
If the price of the original shirt had been $20 and that of the replacement shirt $30, rather than using a $10 increase in price for that sample observation, the CPI would use a $6 increase, attributing the other $4 of the price difference to the difference in the quality of the two shirts.
What is wrong with the CPI
The hedonic quality adjustment aims to consider quality, but its accuracy is questionable. Let’s take an iPhone for example. Battery life may be included in the quality calculations. Its quality may improve year on year, but how is it measured?
Based on the difference between the older version and the newer one. The battery may last twice as long, so that is counted as a 100% increase in quality. The problem with this is that these are statisticians trying to measure the immeasurable. It is extremely difficult to quantify qualitative measures. And when they do, they are going to be wrong a lot of the time.
About Paul
Paul Boyce is an economics editor with over 10 years experience in the industry. Currently working as a consultant within the financial services sector, Paul is the CEO and chief editor of BoyceWire. He has written publications for FEE, the Mises Institute, and many others.

Further Reading
 Adjusted Gross Income - Adjusted gross income refers to an individual's total income from all sources, minus specific deductions and exemptions, and serves as…